Short-Term Holders Under Pressure as Bitcoin Slides—Capitulation Coming?

Bitcoin has not been immune to the ongoing global tariff dispute, which has rippled across financial markets and placed pressure on equities and digital assets.
Over the past two weeks, Bitcoin has dropped by more than 10%, slipping under $75,000 earlier today—a level last seen in November 2024. The pullback coincides with broader market volatility coming from rising geopolitical and economic uncertainty.
Amid this ongoing price move, a crypto analyst has suggested that the behavior of short-term holders during episodes like this is crucial in assessing the extent of ongoing market corrections.
Short-Term Holders Show Early Signs of Stress
According to CryptoQuant contributor Yonsei Dent, the current price action reveals important insights into investor behavior. Dent’s latest analysis centers on the STH-SOPR (Short-Term Holder Spent Output Profit Ratio), a metric that measures whether coins moved by recent buyers are being sold at a profit or loss.
A reading below 1.0 indicates that holders are realizing losses, a sign often interpreted as capitulation. While Bitcoin’s price has declined significantly, Dent points out that the STH-SOPR has not yet breached extreme levels seen in past correction events.

Unlike major capitulation periods in 2024—such as those in May, July, and August—the current SOPR remains near its mean value, indicating that many short-term holders are not yet exiting their positions en masse.
The absence of widespread capitulation raises questions about the potential for further downside. Dent warns that if selling pressure among short-term holders intensifies, the market could experience another wave of losses.
For now, all eyes remain on the $78,000 support level, which may act as a key test for whether Bitcoin can stabilize or if deeper correction lies ahead. Yonsei Dent wrote:
If STHs begin to exit more aggressively, the market could face further downside pressure. In the near term, close attention should be paid to whether the $78,000 support level can hold, as it may serve as a key line in the sand for the current market structure.
Technical Outlook On Bitcoin
Meanwhile, technical analysts’ outlook on BTC is slightly different. According to an analyst known as Merlijn The Trader on X, BTC is currently in what is termed the “green zone” where it is an ideal opportunity for accumulation.
BITCOIN IS IN THE GREEN ZONE.
This is where legends bought in 2015, 2019, and 2020.
Red is for selling. Green is for buying.
Don’t overthink it. pic.twitter.com/hhSYEpkNNb
— Merlijn The Trader (@MerlijnTrader) April 6, 2025
Featured image created with DALL-E, Chart from TradingView
Read More

Bitcoin Holds Above 365-Day Moving Average, But Market Sentiment Remains Subdued
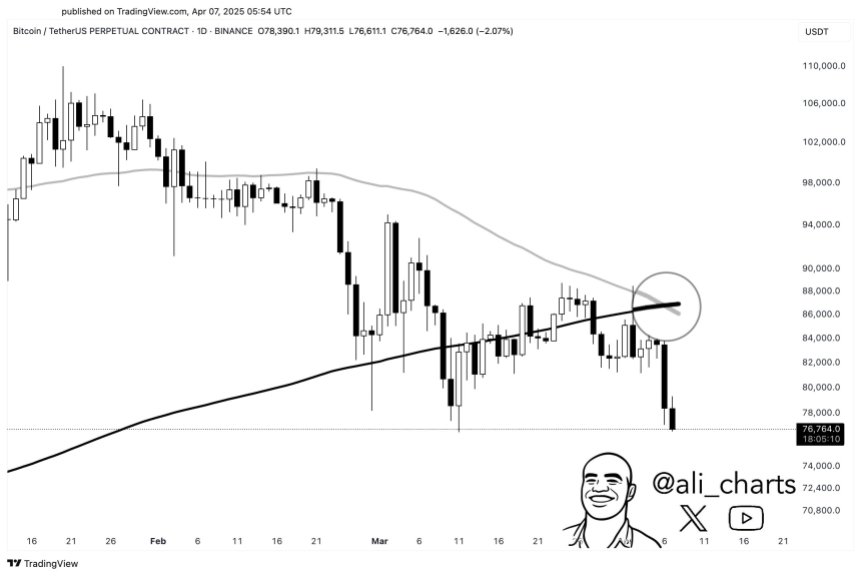
Bitcoin Flashes ‘Death Cross’ Amid Tariff-Induced Market Turmoil – Is Further Decline Inevitable?

The global equity and cryptocurrency markets experienced significant downturns earlier today, as US President Donald Trump’s country-specific reciprocal tariffs are set to take effect on April 9. The leading cryptocurrency, Bitcoin (BTC), has declined by more than 7% in the past 24 hours, and analysts predict further near-term challenges for the digital asset.
US Tariffs Lead To Crypto Market Rout
Notably, Trump’s baseline 10% tariffs on all countries went into effect on April 5, while the higher, country-specific reciprocal tariffs are scheduled to commence on April 9. These developments have raised fears of a global recession and widespread job losses.
The digital assets market has felt the impact of these tariffs, with BTC slipping over 7% in the past 24 hours – from approximately $82,300 on April 6, to a low of around $74,500 earlier today.
Altcoins such as Ethereum (ETH), Solana (SOL), and XRP have experienced even greater declines, tumbling by 17.2%, 16%, and 15.8% respectively over the past 24 hours. Similarly, the total crypto market capitalization has shed almost $130 billion during the same period.
Commenting on BTC’s price action amid the market turmoil, seasoned crypto analyst Ali Martinez highlighted that there may be more challenges ahead for the leading digital asset, as it has flashed the infamous death cross on the daily chart, indicating the potential for further price pullbacks.

For the uninitiated, a death cross is a bearish technical signal that appears when the 50-day moving average (MA) drops below the 200-day MA. It often suggests a potential downtrend or increased selling pressure in the market.
Similarly, veteran trader Peter Brandt shared the following chart, showing BTC trading in a symmetrical triangle pattern, with a wedge retest located at $81,024. The trader hinted that BTC may follow a drop to the 50% retracement level of $54,000.

To elaborate, a symmetrical triangle pattern in trading is a chart formation where the price consolidates with converging trend lines connecting a series of lower highs and higher lows, indicating a period of indecision before a potential breakout in either direction.
Similarly, a wedge retest refers to the price action where, after breaking out from a wedge pattern – a formation with converging trend lines – the price returns to test the breakout level before continuing in the breakout direction.
An Opportunity To Stack Bitcoin?
While heightened fears surrounding further price declines in BTC have unsettled investors and traders alike, some risk-seeking investors view this as an opportunity to accumulate more BTC at lower prices.
For instance, CryptoQuant analyst BorisVest, in a recent analysis, emphasized that if BTC falls between $65,000 to $71,000, it could offer a favorable buying opportunity for investors with a decent risk-reward ratio. At press time, BTC trades at $76,678, down 7.5% in the past 24 hours.


