Arbitrum (ARB) Poised For Resurgence: Downtrend Reaching Climax?
Share:
Predictions Markets
See what traders are focused on

Generally, the crypto market has been experiencing a pullback after Bitcoin and many other coins like Ethereum have recorded a new all-time high of which Arbitrum (ARB) was not left behind.
Arbitrum, which has a lot of potential with a market cap of over $3.8 billion and a circulating supply of 2,653,939,384 ARB has been trading below the 100-day Moving Average (MA) for some time now. However, recently the price of ARB has been showing some signs of reversing.
As of the time of writing, Arbitrum was trading around $1.45, indicating an increase of 1% in the last 24 hours. There are currently two major resistance levels of $1.799 and $2.278 ahead of the price.
Technical Indicators Show Signs Of Upward Movement In Arbitrum Price
4-hour RSI Indicator: Looking at the Relative Strength Index (RSI) indicator from the 4-hour timeframe, we can see that the RSI line is rising above the oversold zone and is heading toward the 50 level. This indicates a rise in the price, and if the RSI line rises above the 50 level, it might trigger the start of a new trend.
The image below reveals more:
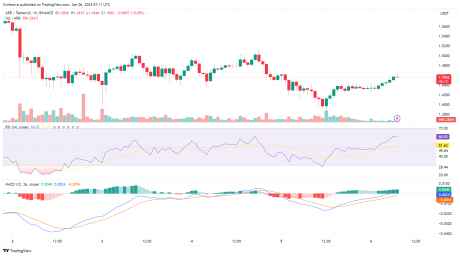
4-hour MACD: looking at the formation of the MACD indicator from the 4-hour timeframe in the above image, we can also see that both the MACD line and the signal line having trended for a while below the MACD zero line have both crossed and are heading towards the MACD zero line.
On the other hand, the MACD histogram is already trending above the MACD zero line. This suggests that a change in direction might soon happen from its downward movement to an upward movement.
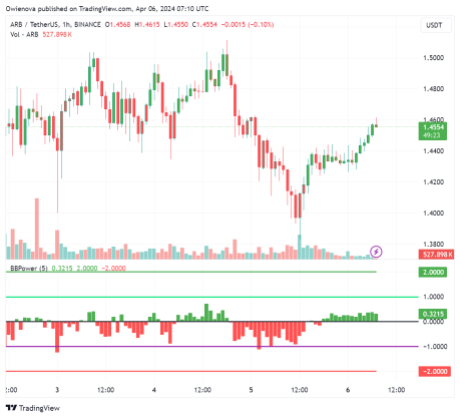
1-hour bull power vs bear power histogram indicator: lastly, taking a good look at the chart from the 1-hour time frame with the help of the bull power vs bear power indicator, it shows that the histograms are already trending above the zero level. This suggests that buyers are gradually taking over the market from sellers as seen in the image below.
In conclusion, if the price of Arbitrum manages to change its direction from downward to upward direction, it is possible that ARB could retest its previous major resistance levels of $1.799 and $2.278 and even move further to create a new peak. Nonetheless, if Arbitrum fails to move upward, the crypto asset’s price might move further downward to create a new low.


Read More
Cryptocurrency Market Activity: Bitcoin Surpasses $64,000, Whale Activity is High! Here are the Altcoins They’re Trading