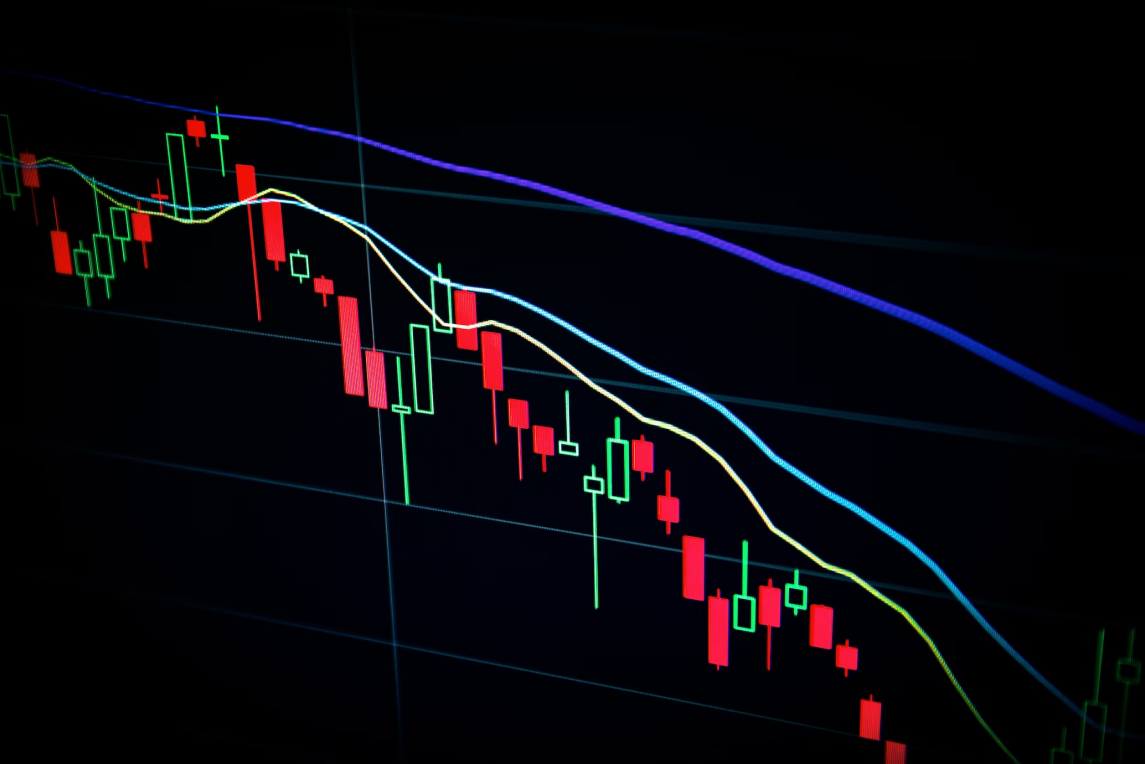
BTC/USDT Spot CVD Chart Analysis: May 20, 5:00 a.m. UTC

Share:
Predictions Markets
See what traders are focused on

BitcoinWorld
BTC/USDT Spot CVD Chart Analysis: May 20, 5:00 a.m. UTC
The Spot Cumulative Volume Delta (CVD) chart for the BTC/USDT trading pair offers traders a granular view of order book dynamics. As of 5:00 a.m. UTC on May 20, the chart presents two key layers of data: the Volume Heatmap and the CVD indicator, which together can help identify potential price levels of interest.
Understanding the Volume Heatmap
The upper portion of the chart displays the Volume Heatmap, which tracks trading activity at various price levels. The background color intensifies when the price lingers in a specific range or undergoes significant movement. These brighter zones often act as markers for potential support and resistance areas, as they represent price levels where substantial trading volume has occurred.
Interpreting the Cumulative Volume Delta
Below the heatmap, the Cumulative Volume Delta (CVD) indicator provides a running tally of buy and sell orders, categorized by trade size. As buy orders accumulate, the corresponding colored line rises. For instance, the yellow line tracks orders ranging from $100 to $1,000, while the brown line monitors large institutional-sized orders between $1 million and $10 million. Divergences between these lines can offer clues about shifting market sentiment.
Why This Matters for Traders
For active traders, the CVD chart provides a real-time snapshot of order flow, helping to distinguish between retail and large-scale activity. A rising brown line, for example, may signal accumulation by institutional players, while a flattening yellow line could indicate reduced retail participation. This information can be used to confirm breakouts or identify potential reversals.
Conclusion
The Spot CVD chart for BTC/USDT at 5:00 a.m. UTC on May 20 offers a data-driven perspective on market structure. By combining the Volume Heatmap with the CVD indicator, traders can gain a deeper understanding of price levels where buying or selling pressure is concentrated, aiding in more informed decision-making.
FAQs
Q1: What is the Cumulative Volume Delta (CVD)?
A: CVD is a technical indicator that tracks the net difference between buying and selling volume over time, categorized by trade size. It helps traders identify whether buyers or sellers are in control at specific price levels.
Q2: How does the Volume Heatmap differ from CVD?
A: The Volume Heatmap shows the total trading volume at each price level, highlighting areas of high activity. CVD, on the other hand, shows the cumulative delta between buy and sell orders, indicating directional pressure.
Q3: Can the CVD chart predict price movements?
A: No single indicator can predict price movements with certainty. The CVD chart is a tool for analyzing order flow and market sentiment, which can be used in conjunction with other forms of analysis to inform trading decisions.
This post BTC/USDT Spot CVD Chart Analysis: May 20, 5:00 a.m. UTC first appeared on BitcoinWorld.


Read More

Bitcoin gets a green light from a reliable momentum gauge. Here are key levels to watch