Ethereum Price Retests Uptrend Support Amidst Market Turmoil

Share:
Key Points:
- Ethereum’s price fails to clear the $1,975 resistance and starts a downside correction, trading below $1,950 level.
- Immediate resistance is near the $1,925 level and the next major resistance is near the $1,945 level.
- Clear move above $1,945 resistance could push the price towards $1,975 and the next major resistance is near the $2,120 level.
Ethereum‘s price has encountered a downside correction, failing to clear the $1,975 resistance level.

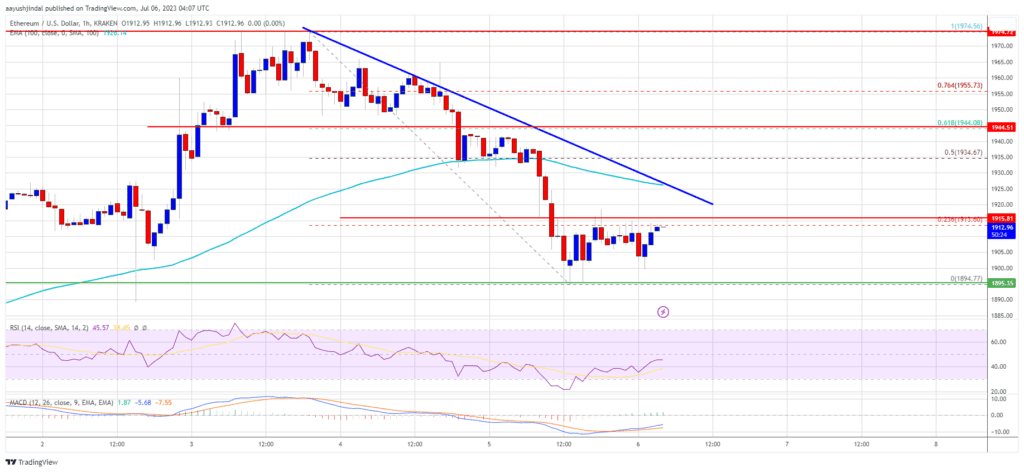
As a result, there has been a decline below $1,950, similar to Bitcoin, and even below the $1,920 support level. The price eventually spiked below $1,900, reaching a low of $1,894, and is now consolidating losses. Currently, the price is near the 23.6% Fib retracement level of the recent decline from the $1,974 swing high to the $1,894 low.
Ether is now trading below $1,940 and the 100-hourly Simple Moving Average, indicating a bearish trend. On the hourly chart of ETH/USD, there is a key bearish trend line with resistance near $1,925. The immediate resistance level stands near the $1,925 level, which is the 100-hourly Simple Moving Average. The next major resistance level is at $1,945, which is close to the 61.8% Fib retracement level of the recent decline from the $1,974 swing high to the $1,894 low.

However, if there’s a clear move above the $1,945 resistance level, the price could be pushed toward $1,975. This could be a significant milestone for Ether as the main resistance level still remains near the $2,000 level. A successful push above this level could initiate a decent increase in the value of Ether. The next major resistance level is near $2,120, and any further gains could propel Ethereum toward the $2,200 resistance level.
Ethereum’s recent price decline and consolidation could be attributed to its inability to clear the $1,975 resistance level. However, the presence of key bearish trend lines and resistance levels should not be ignored. Traders and investors should keep a close eye on the $1,945 and $2,000 resistance levels, as these will be crucial in determining the future price action of Ether.
DISCLAIMER: The Information on this website is provided as general market commentary and does not constitute investment advice. We encourage you to do your own research before investing.
Coincu News
Ethereum Price Retests Uptrend Support Amidst Market Turmoil

Share:
Key Points:
- Ethereum’s price fails to clear the $1,975 resistance and starts a downside correction, trading below $1,950 level.
- Immediate resistance is near the $1,925 level and the next major resistance is near the $1,945 level.
- Clear move above $1,945 resistance could push the price towards $1,975 and the next major resistance is near the $2,120 level.
Ethereum‘s price has encountered a downside correction, failing to clear the $1,975 resistance level.

As a result, there has been a decline below $1,950, similar to Bitcoin, and even below the $1,920 support level. The price eventually spiked below $1,900, reaching a low of $1,894, and is now consolidating losses. Currently, the price is near the 23.6% Fib retracement level of the recent decline from the $1,974 swing high to the $1,894 low.
Ether is now trading below $1,940 and the 100-hourly Simple Moving Average, indicating a bearish trend. On the hourly chart of ETH/USD, there is a key bearish trend line with resistance near $1,925. The immediate resistance level stands near the $1,925 level, which is the 100-hourly Simple Moving Average. The next major resistance level is at $1,945, which is close to the 61.8% Fib retracement level of the recent decline from the $1,974 swing high to the $1,894 low.

However, if there’s a clear move above the $1,945 resistance level, the price could be pushed toward $1,975. This could be a significant milestone for Ether as the main resistance level still remains near the $2,000 level. A successful push above this level could initiate a decent increase in the value of Ether. The next major resistance level is near $2,120, and any further gains could propel Ethereum toward the $2,200 resistance level.
Ethereum’s recent price decline and consolidation could be attributed to its inability to clear the $1,975 resistance level. However, the presence of key bearish trend lines and resistance levels should not be ignored. Traders and investors should keep a close eye on the $1,945 and $2,000 resistance levels, as these will be crucial in determining the future price action of Ether.
DISCLAIMER: The Information on this website is provided as general market commentary and does not constitute investment advice. We encourage you to do your own research before investing.
Coincu News


