Dogecoin Flirts With An Inverse Head And Shoulders: $0.15 Break Is The Trigger

Share:
Dogecoin (DOGE) is showing potential for a breakout, with a daily inverse head-and-shoulders pattern indicating a target of approximately $0.19. Key support is found in the $0.1250 to $0.1350 range, while resistance lies between $0.149 and $0.152, crucial for maintaining bullish momentum. The 2-day Bollinger Bands suggest bullish sentiment if DOGE can hold above these levels.
Predictions Markets
See what traders are focused on

Dogecoin (DOGE) is trying to base on higher timeframes as Cantonese Cat points to a potential inverse head-and-shoulders on the daily, with price compressing just beneath a defined resistance shelf while holding a nearby demand zone.
Dogecoin Breakout Could Target $0.19
In a daily chart (DOGE/USD, Binance) shared via X on Jan. 16, Cantonese Cat overlays an inverse head-and-shoulders schematic: a left shoulder in early December, a deeper “head” into late December near the mid-$0.11s, and a developing right shoulder as price rotates lower after the early-January spike.
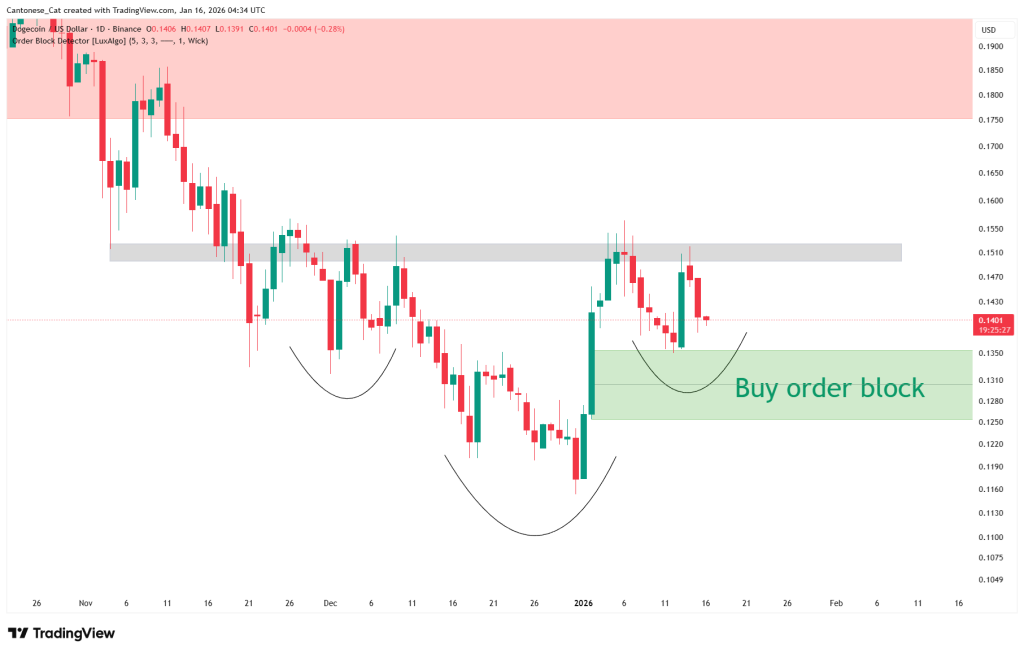
The key feature on that daily view is a highlighted “Buy order block” spanning roughly $0.1250 to $0.1350. Price is shown pulling back toward the top of that block after failing to hold the most recent push higher, which places the current trade location in a classic “right shoulder” area if the pattern is going to remain constructive.
Above the current spot price, the chart marks a horizontal grey resistance (“the shoulder”) band at roughly $0.149–$0.152. This is the area DOGE needs to reclaim for the inverse H&S thesis to transition from “forming” to “triggering,” because it has acted as supply on recent tests.
Using Cantonese Cat’s daily inverse head-and-shoulders chart, the measured move is the neckline minus the head low, projected upward from the neckline: the neckline is the grey supply band centered near $0.151 (label on the axis), while the head prints at roughly $0.116. That gives a height of about $0.035, implying a pattern target near $0.186.
Notably, that objective runs directly into the chart’s overhead red supply zone, which begins around $0.175 and extends up toward $0.19, making that area the first obvious region where a confirmed breakout would be expected to meet meaningful resistance.
DOGE 2-Day Bollinger Bands Signal Momentum
Notably, the Bollinger Bands on the 2-day chart support the mid-term bullish thesis. On Tuesday, Cantonese Cat highlighted that DOGE is trading above the Bollinger basis around $0.1343, while the upper band is near $0.1526 and the lower band near $0.1160.
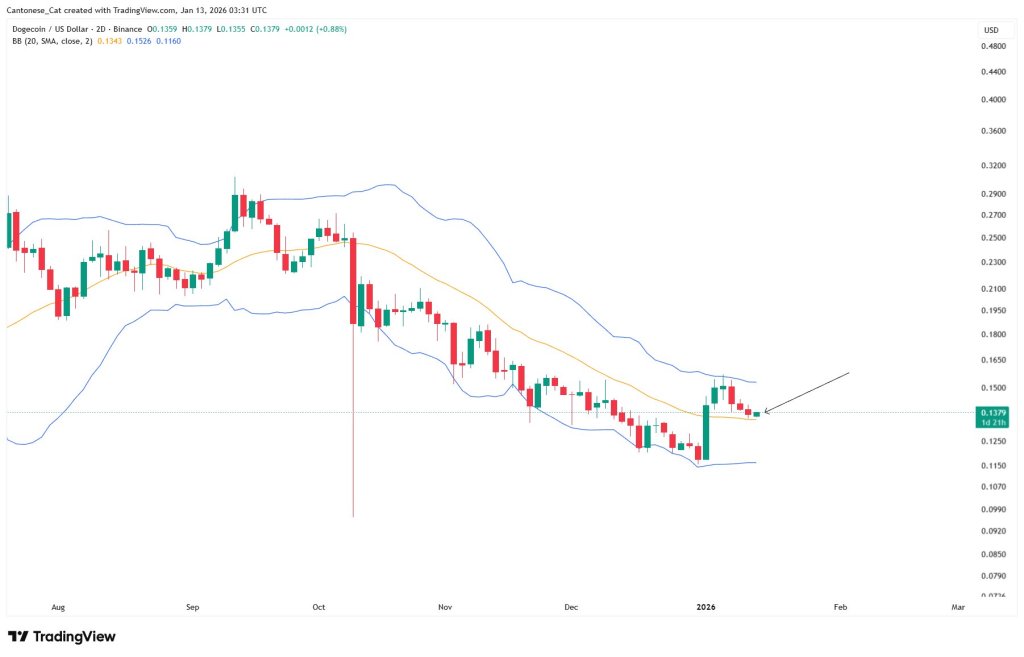
Cantonese Cat summarized the idea succinctly: “Price wanting to hang out at the top part of the Bollinger band? We have a chance here?” In practice, the “top part” framing matters because it’s a momentum tell. After an extended decline, sustained closes above the basis and into the upper half of the bands can signal that sellers are no longer controlling the volatility profile, even before price clears the obvious horizontal resistance.
That said, the 2D view also makes the immediate problem clear: the upper band sits close to the same zone highlighted on the daily as resistance. In other words, the bullish thesis is not just “hold support,” but “prove it” with acceptance above the $0.15–$0.152 region.
If DOGE continues to defend the $0.1250–$0.1350 buy-side block and reclaims the $0.149–$0.152 supply band, the inverse head-and-shoulders thesis gains credibility. The next areas the chart itself flags are the higher supply zones around $0.175 and the upper-$0.18s region, where prior selling pressure was visible.
If price loses the buy order block, the pattern read weakens materially. In that case, the Bollinger structure on the 2D chart points attention back toward the lower band region near $0.1160 and the late-December lows.
At press time, DOGE traded at $0.139.


Read More

Dogecoin Traders Watch $0.13 As DOGE Reclaims A Key Technical Level