
PEPE Leads the Pack: Outpacing Other MEME Coins In Market Surge

Share:
Predictions Markets
See what traders are focused on

PEPE price is up over 10% and outpacing other meme coins. The price could continue to rise toward the $0.0000125 level in the near term.
- PEPE started a fresh increase above the $0.0000105 level.
- The price is now trading above $0.0000110 and the 100-hourly Simple Moving Average.
- There is a breakout pattern forming with resistance at $0.0000115 on the hourly chart of the PEPE/USD pair (data source from Kraken).
- The pair could rally further if there is a close above the $0.0000115 resistance.
PEPE Price Surges Over 10%
In the past few sessions, PEPE saw a steady increase above the $0.000010 resistance. It outpaced Bitcoin ,Ethereum, and MEME coins. There was a 10% increase, and the bulls were able to push the price above the $0.0000110 level.
It traded as high as $0.00001148 and is currently consolidating gains. The price is holding gains above the 23.6% Fib retracement level of the upward move from the $0.00000959 swing low to the $0.00001148 high. It is also well above the $0.000011 and the 100-hourly Simple Moving Average.
Immediate resistance is near the $0.0000115 level. There is also a breakout pattern forming with resistance at $0.0000115 on the hourly chart of the PEPE/USD pair.
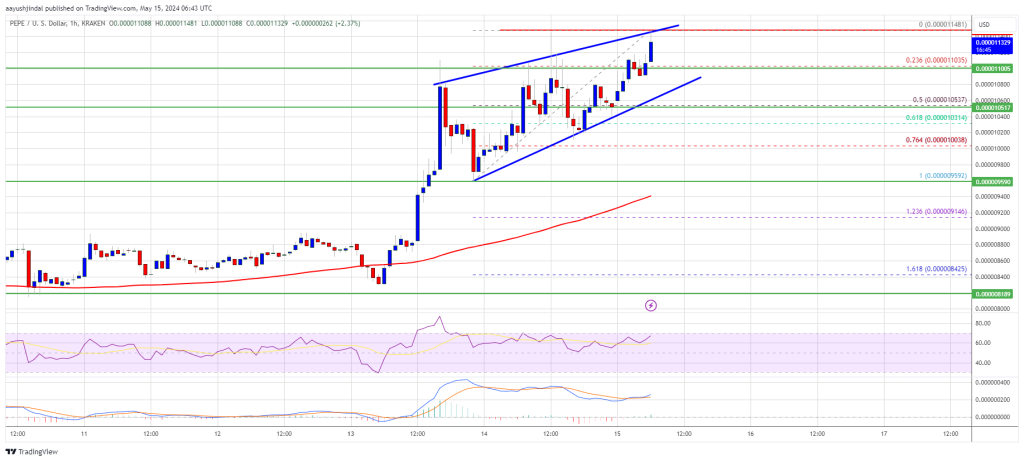
The first key resistance is near $0.00001155. A close above the $0.00001155 resistance zone could send the price higher. The next key resistance is near $0.000012. If the bulls remain in action above the $0.000012 resistance level, there could be a rally toward the $0.0000125 resistance. Any more gains might send the price toward the $0.0000132 resistance.
Are Dips Limited?
If PEPE fails to clear the $0.0000115 resistance zone, it could start a downside correction. Initial support on the downside is near the $0.0000110 level. The next major support is at $0.0000105 or the 50% Fib retracement level of the upward move from the $0.00000959 swing low to the $0.00001148 high.
If there is a downside break and a close below the $0.0000105 level, the price might accelerate lower. In the stated case, the price could even drop below the $0.000010 support zone.
Technical Indicators
Hourly MACD – The MACD for PEPE/USD is now gaining pace in the bullish zone.
Hourly RSI (Relative Strength Index) – The RSI for PEPE/USD is now above the 60 level.
Major Support Levels – $0.0000110 and $0.0000105.
Major Resistance Levels – $0.0000115 and $0.0000120.
In This News
Coins

$ 63.15K
+1.61%
$ 1.75K
+0.65%
$ 0.00...361

$ 0.022


Predictions Markets
See what traders are focused on
Share:
In This News
Coins
$ 63.15K
+1.61%$ 1.75K
+0.65%$ 0.00...361
$ 0.022
Predictions Markets
See what traders are focused on
Share: