Bitcoin Price Prediction: BTC Risks Drop Toward $55K After $60K Breakdown
Share:
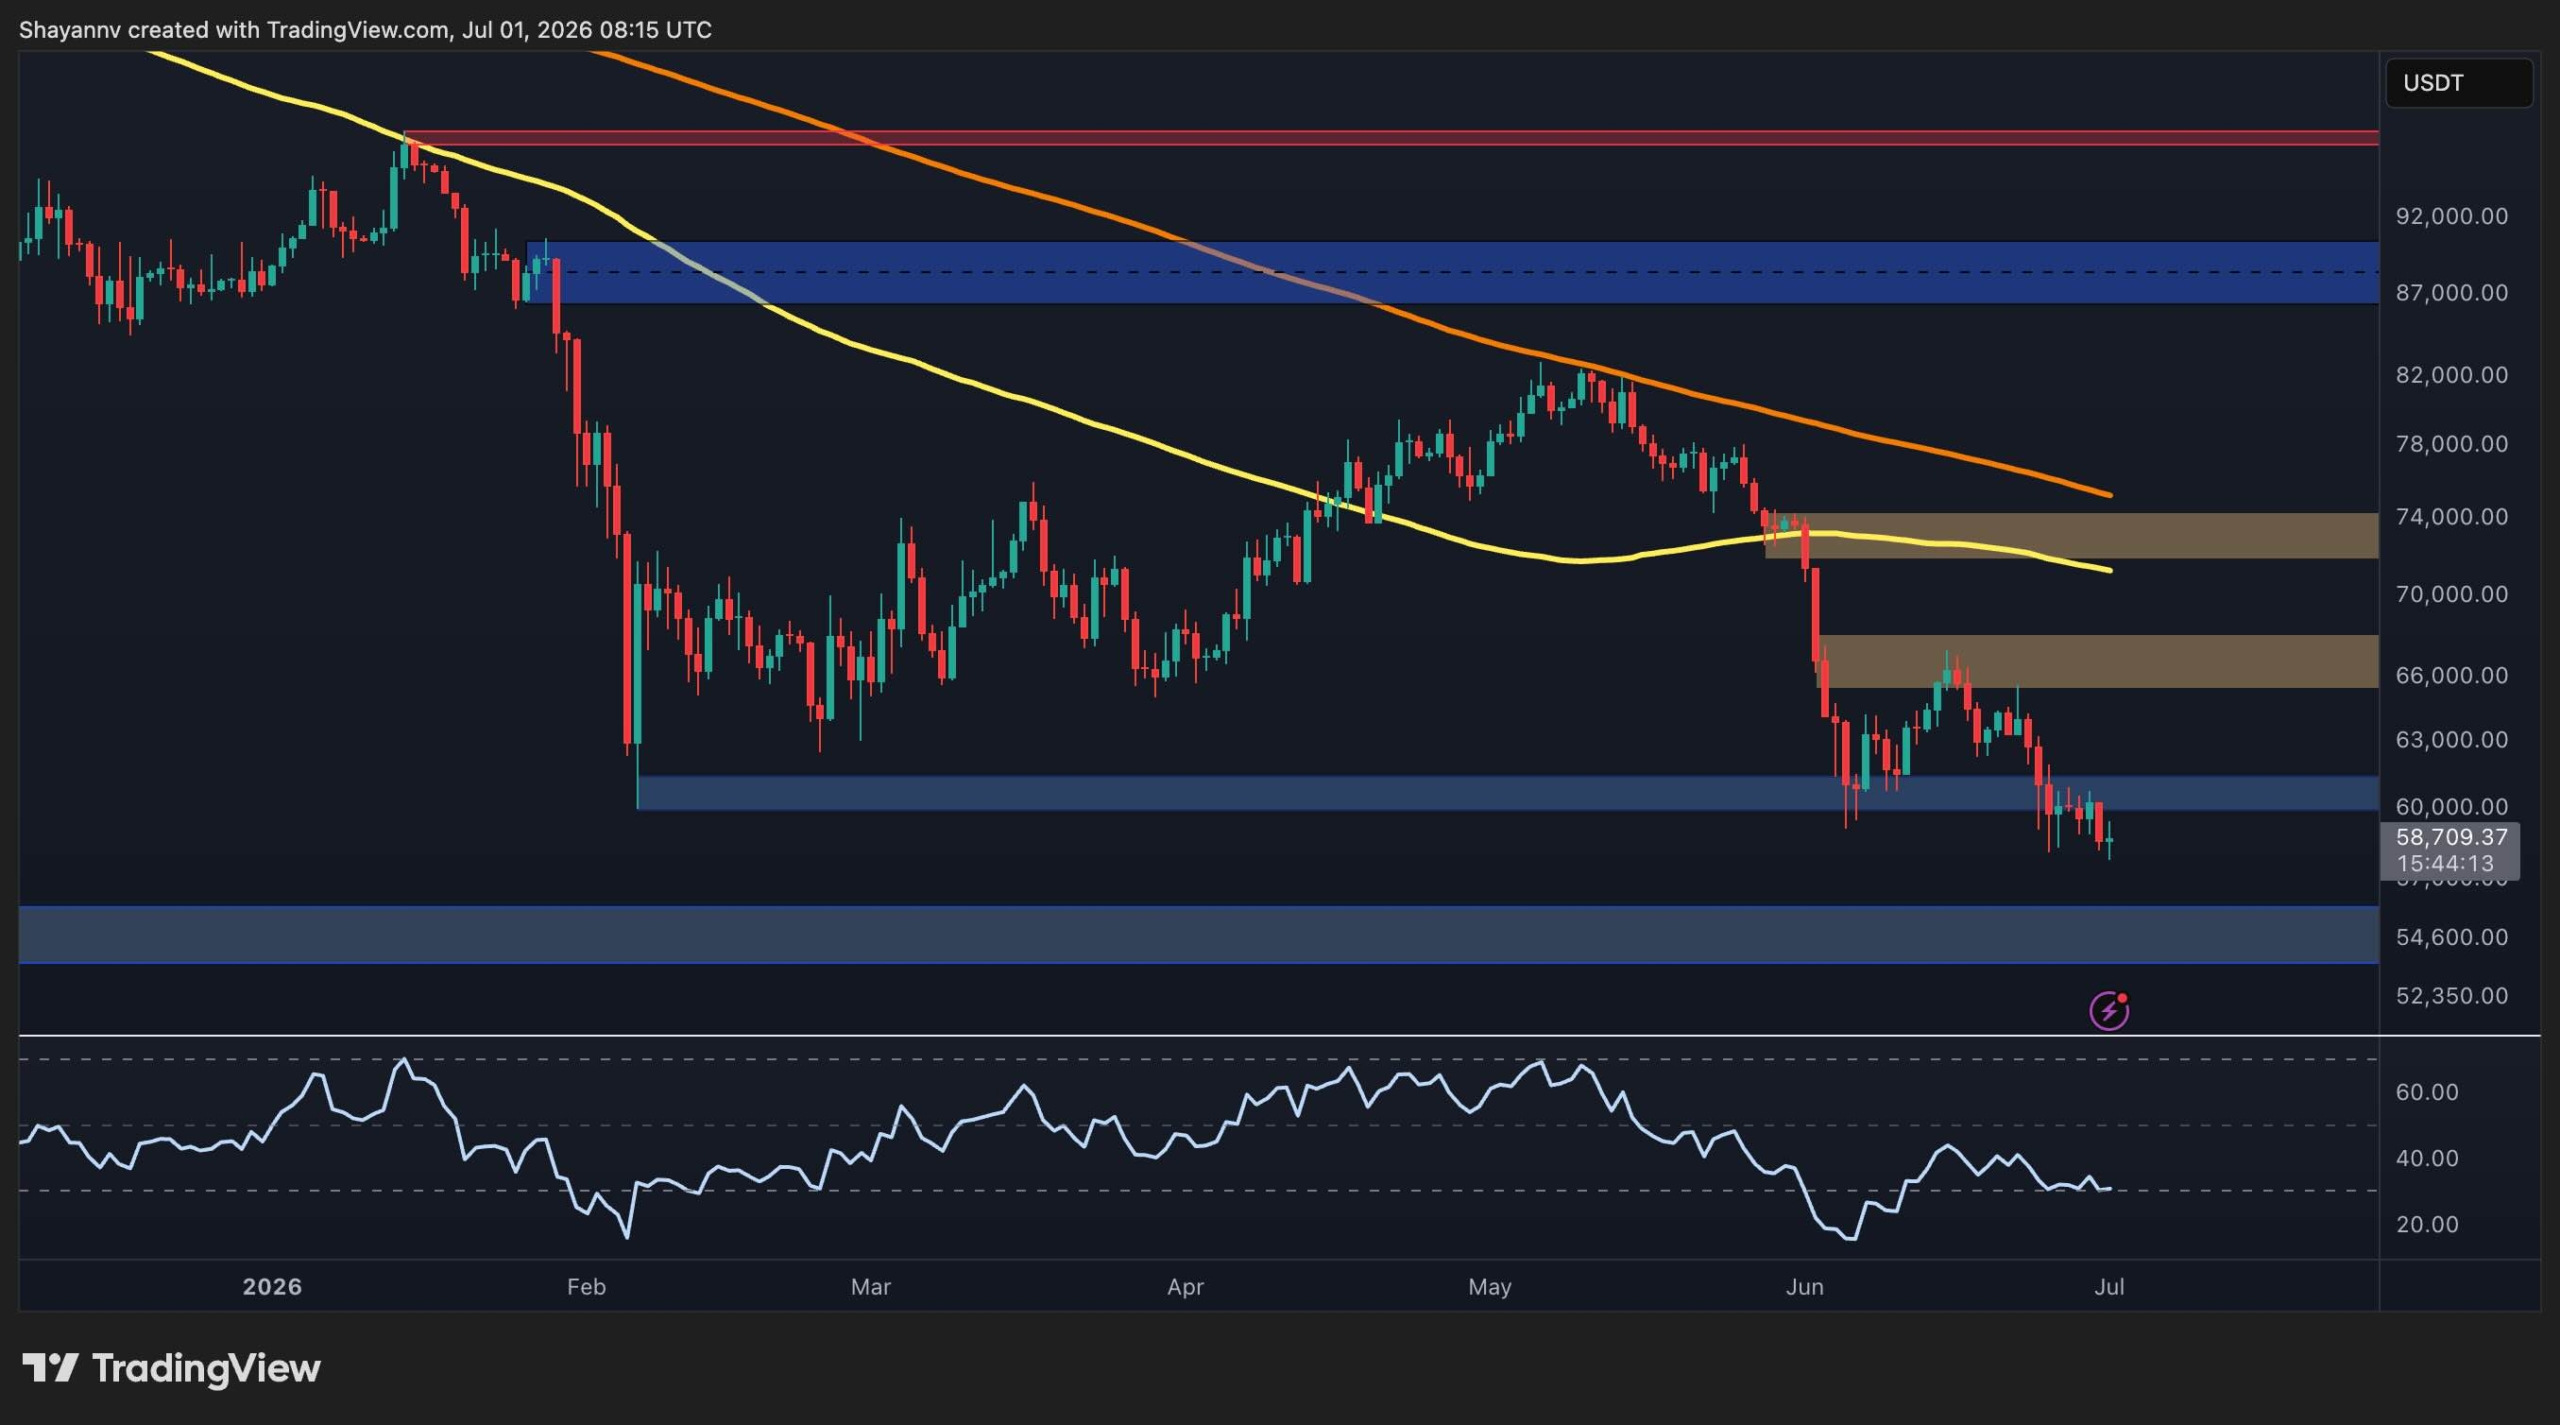
Bitcoin is breaking down below the key $60K support as sellers dominate and momentum points to a potential deeper correction toward the mid-$50K region. On the daily chart BTC shows an extended bearish trend after rejection at the 200-day moving average (~$80K) and breakdown of the 100-day moving average (~$74K), with both MAs now sloping lower and acting as resistance, signaling downside risk for crypto markets and traders.
Predictions Markets
See what traders are focused on

Bitcoin’s battle around the $60K region is entering a decisive phase after sellers are forcing a breakdown below this major support area. With momentum still favoring the sellers, traders are now watching whether demand can prevent a deeper correction toward the mid-$50K region.
Bitcoin Price Analysis: The Daily Chart
On the daily timeframe, BTC has extended its bearish trend after losing several major support zones. The recent rejection by the 200-day moving average around $80K and the breakdown of the 100-day moving average near $ 74 K have reinforced the longer-term downtrend, with both moving averages now sloping lower and acting as dynamic resistance.
In This News
Coins

$ 63.99K
+1.31%
$ 0.0018
Predictions Markets
See what traders are focused on
Share:
In This News
Coins
$ 63.99K
+1.31%$ 0.0018
Predictions Markets
See what traders are focused on
Share:
Read More
Bitcoin Price Analysis: Has BTC Cleared the Danger Zone After $64K Surge?