Bitcoin Holds $78K After 24% August Rally: Is a September Correction Coming?

Share:
Bitcoin is trading around $78,320 after a modest pullback and finished August up roughly 24% after rising from about $60,000 to a high of $81,455, with U.S. spot Bitcoin ETFs reportedly attracting over $3 billion in August including about $924 million in the final week, indicating strong institutional demand and adoption. However, historical seasonality shows September averages about a 3% decline after big July/August rallies, and despite a bullish 50/100-day moving average cross and upside targets of $88,000–$90,000, traders warn of a potential pullback (historically up to ~17%) with key support near $75,568 and downside risk toward $74,000.
Predictions Markets
See what traders are focused on

Bitcoin, the pioneer cryptocurrency, is now trading around $78,320 after a modest pullback, but it is still up about 2% over the past week. While BTC is ending August with a strong 24% gain, raising the question of whether the rally will continue into September, a month that has historically seen an average 3% decline.
Here’s what the historical data suggests.
Bitcoin Ends August With 24% Gain
Since the start of August, Bitcoin has jumped 26%, rising from around $60,000 to a high of $81,455. The strong move also helped Bitcoin break its long-running pattern of weak August performance.
One of the key reasons behind Bitcoin’s jump came after the U.S. Treasury doubled its long-term bond buybacks from $2 billion to at least $4 billion per operation.
At the same time, institutional demand for Bitcoin picked up, with U.S. spot Bitcoin ETFs reportedly attracting more than $3 billion in August, including about $924 million in the final week.
Despite Bitcoin’s strong August, the market is now entering a historically weaker period. September has been Bitcoin’s worst performing month on average, with the cryptocurrency posting an average return of around -3%.
Strong July and August Could Set Up a Weak September
The CoinGlass data shows an interesting pattern heading into September. In several years, Bitcoin posted strong gains in both July and August, only to see a correction in September.
For example, Bitcoin gained 9.60% in July and 30.42% in August 2013, before falling 1.76% in September. The same pattern appeared in 2017, when BTC jumped 17.92% in July and 65.32% in August, followed by a 7.44% drop in September.
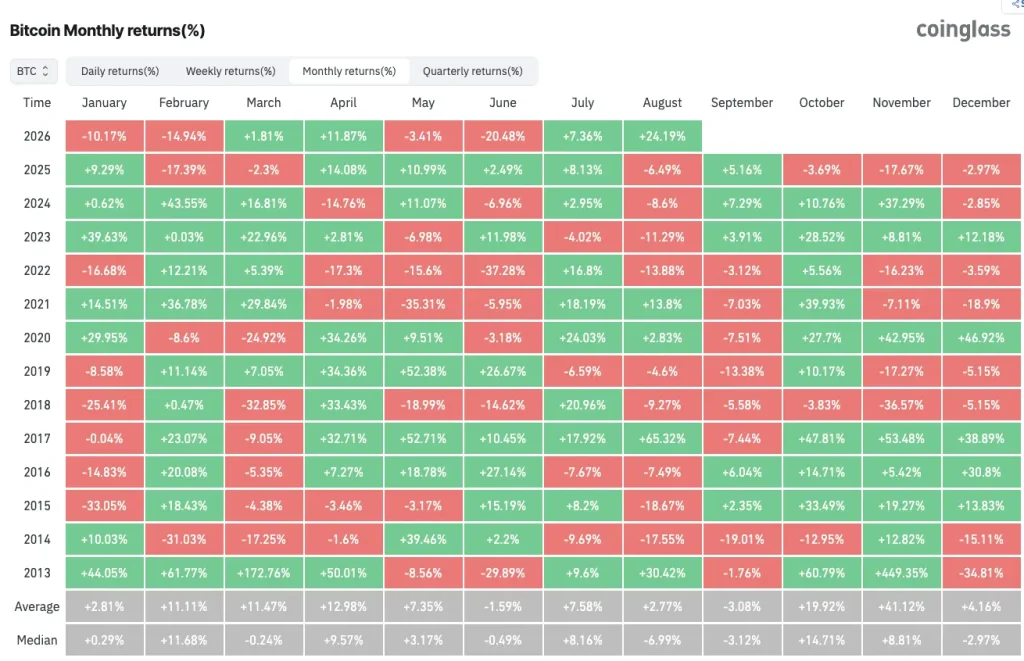
Bitcoin also saw a similar setup in 2020 and 2021. In 2020, BTC rose 24.03% in July and 2.83% in August before losing 7.51% in September. In 2021, it gained 18.19% and 13.80% in July and August, then fell 7.03% in September.
Now, 2026 is showing a similar pattern. Bitcoin gained 7.36% in July before surging 24.19% in August. While this does not mean September will definitely fall, history gives traders a reason to watch for a pullback.
Still, a September dip may not end the larger rally. October has delivered an average return of 19.92%, while November has averaged 41.12%.
Bitcoin Price Outlook: Key Levels to Watch
Crypto analyst Crypto Rover noted that Bitcoin has formed a bullish cross between its 50-day and 100-day moving averages. A similar signal appeared in January 2023, after which Bitcoin eventually gained 546%.
However, BTC first dropped 17%, raising the question of whether a similar pullback could happen in September.
That does not mean Bitcoin will repeat the same 17% drop, but traders are watching the setup closely.
Meanwhile, crypto trader Ted Pillows said Bitcoin could target $88,000-$90,000 if it reclaims the 50-week moving average.
However, the $75,568 support level remains important. If BTC breaks below the 50-week EMA, Pillows expects the price could fall toward $74,000.


Read More

XRP Rich List: How Much Could 7,500 XRP Be Worth If XRP Price Hits $5?