SEI Price Drops 9% But Technical Indicators Signal Potential Recovery

Share:
Predictions Markets
See what traders are focused on

- SEI price is mildly bearish as it dropped 9% in the last 24 hours.
- Despite the price correction, the sentiments of investors are still on the positive side.
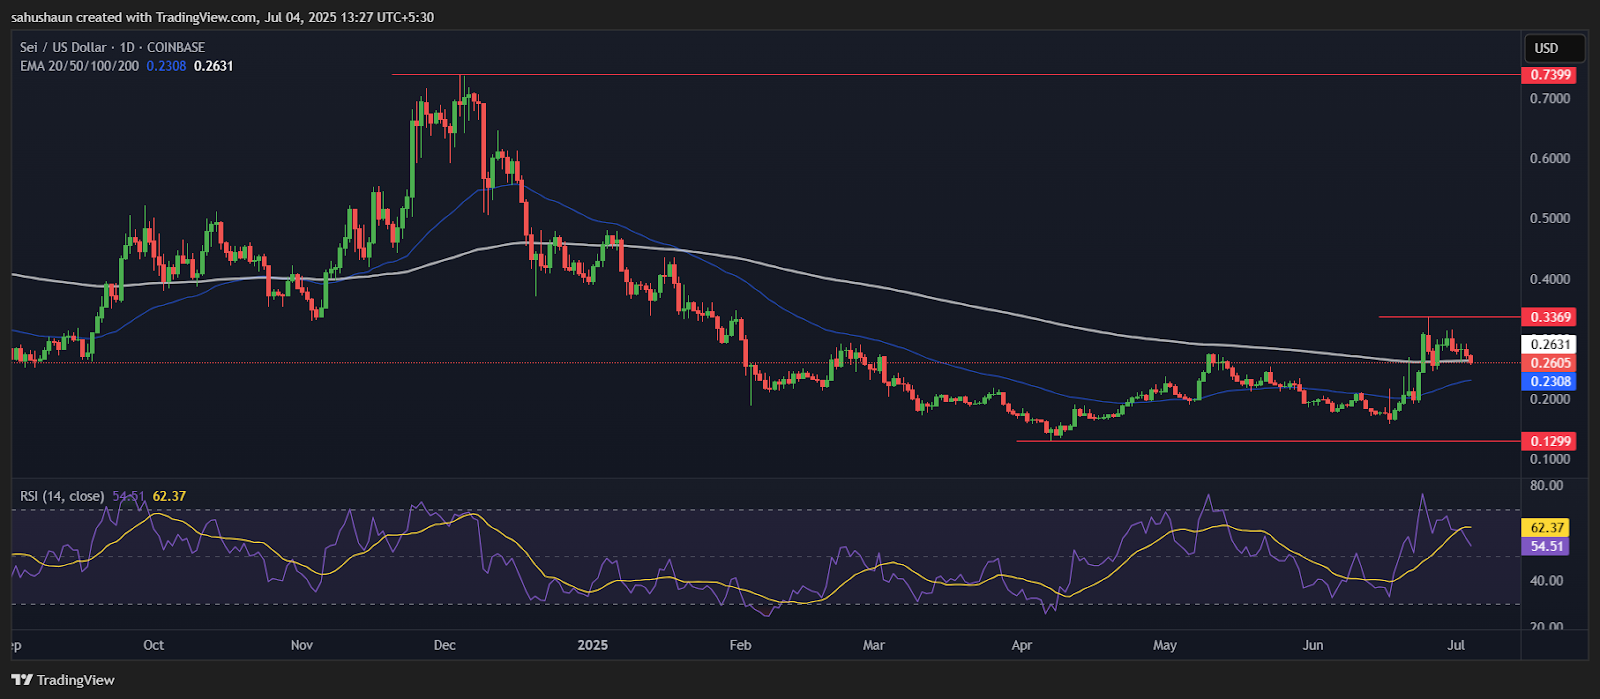
SEI is showing a mild bearish sign on the daily technical chart as its price is facing rejection from $0.3369 level. According to CMC data, Sei’s price dropped by 9% in the last 24 hours, showing a fight between bears and bulls to grab the command of the trend.
The altcoin has recently hit the highs of around $0.74 in late 2024 and entered the corrective period that reduced the price to the current levels of around $0.2631.
The recent price movement indicates that SEI is currently trading close to its 200-day exponential moving average at $0.2631, which is a very important pivot point. This long-term moving average has been serving as dynamic support. In the meantime, the 50-day EMA at $0.2309 offers further support on the downside, and it forms a cushion against any further downward movement.
Using the momentum approach, the RSI of 54 indicates that the asset is in the neutral zone and not overbought or oversold. This placement shows that there is a possibility of movement in both directions, but the present level shows that there is balanced buying and selling pressure.
What’s Next For SEI Price?
The MACD indicator that is in the positive region is especially promising, as it indicates that SEI is still in the bullish zone and momentum has not been lost even after the recent correction. The fact that MACD is above the zero line indicates that the medium-term trend is still in the hands of buyers.
The social sentiment analysis shows that retail investors and the rest of the crypto community have a positive bias that is usually a contrarian signal but may also cause a long-term rally when combined with technicals. This bullish mood is a good base of future upsurges, particularly in the case of technical breakouts.
The recent minor correction seems to be a normal consolidation following the last rally, which gives the asset time to build more support levels. The major support areas are spotted at $0.2308 (where the 50-day EMA is), and a more robust support area at $0.1600, which is a significant historical level.
Moving forward, SEI has an imminent resistance at $0.3369 that implies about 28% gain over the current price. A break above this resistance may lead to a new bullish move and possibly higher resistance levels.
The positive MACD levels, neutral RSI that can move higher, and the positive social sentiment make a positive environment of possible profits, as long as the cryptocurrency can continue to support the current structure and the overall market situation is positive.
Highlighted Crypto News Today:
In This News
Coins

$ 0.0636
-0.90%
$ 0.00...361

$ 0.0145

$ 0.0000824

$ 0.000207


Predictions Markets
See what traders are focused on
Share:
In This News
Coins
$ 0.0636
-0.90%$ 0.00...361
$ 0.0145
$ 0.0000824
$ 0.000207
Predictions Markets
See what traders are focused on
Share:
Read More

Tether News: Q2 Profit Hits $1.5B as USDT Supply Reaches $184.6B