


DOGE Price Analysis: Is DOGE Price Warning A Crash To $0.050?

The post DOGE Price Analysis: Is DOGE Price Warning A Crash To $0.050? appeared first on Coinpedia Fintech News
The daily chart of DOGE price action shows a falling wedge pattern with an ongoing correction phase. The Dogecoin price action also forms a long consolidation range with a fakeout of the $0.64 resistance zone.
Furthermore, the bears are in control as the price of DOGE has dropped by 60% since November 2022, trapped in a long-term downtrend. The future appears bleak for the dog-themed memecoin as the key EMAs continue to trend downward.
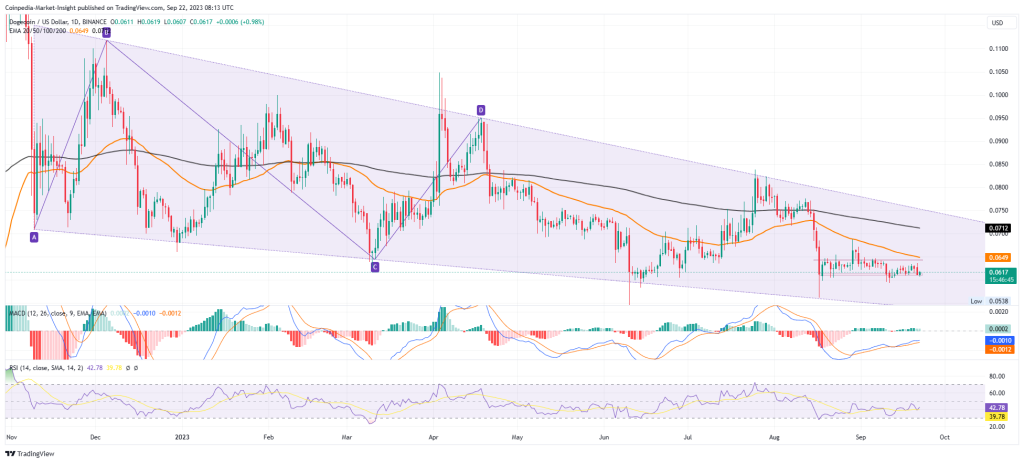
Currently, the DOGE price ongoing brawl between bulls and bears is evident within the consolidation range. Moreover, due to the market-wide correction, the recent red candle warns of a bearish outcome.
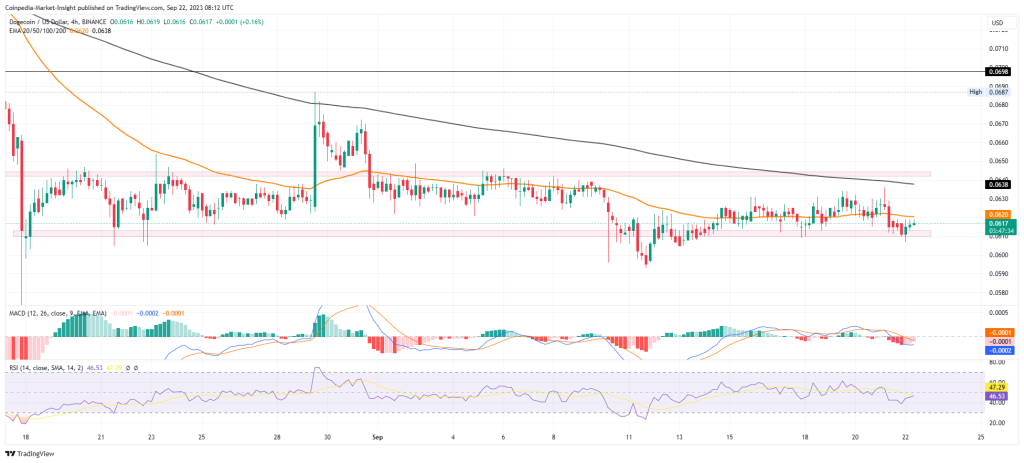
In the 4-hour chart, the consolidation range becomes even clearer, with fakeouts of either side evident over the past weeks. However, the recent fallback faces opposition from the buyers present at the bottom support, leading to a reversal sprout.
Nevertheless, the overhead supply pressure and the fear-covered market conditions may soon break down the range. Currently, the DOGE price trades at $0.0617 while showing some signals of a bullish recovery.
Technical indicators:
MACD indicator: With the bullish sprout at the support zone, the bearish histograms are on a decline. This increases the possibility of a bullish crossover.
RSI indicator: Falling sharply under the halfway line, the RSI line starts a small recovery phase.
Will DOGE Price Manage A Recovery?
With a recovery sprouting in the 4-hour chart, the chances of a bull cycle are minimal compared to a prolonged sideways trend. Therefore, the DOGE price may soon hit the overhead zone at $0.064 and elongate the consolidation range.
On the flip side, a downfall below $0.064 will plunge the DOGE price lower to the $0.050 psychological mark.
Read More


DOGE Price Analysis: Is DOGE Price Warning A Crash To $0.050?
The post DOGE Price Analysis: Is DOGE Price Warning A Crash To $0.050? appeared first on Coinpedia Fintech News
The daily chart of DOGE price action shows a falling wedge pattern with an ongoing correction phase. The Dogecoin price action also forms a long consolidation range with a fakeout of the $0.64 resistance zone.
Furthermore, the bears are in control as the price of DOGE has dropped by 60% since November 2022, trapped in a long-term downtrend. The future appears bleak for the dog-themed memecoin as the key EMAs continue to trend downward.
Currently, the DOGE price ongoing brawl between bulls and bears is evident within the consolidation range. Moreover, due to the market-wide correction, the recent red candle warns of a bearish outcome.
In the 4-hour chart, the consolidation range becomes even clearer, with fakeouts of either side evident over the past weeks. However, the recent fallback faces opposition from the buyers present at the bottom support, leading to a reversal sprout.
Nevertheless, the overhead supply pressure and the fear-covered market conditions may soon break down the range. Currently, the DOGE price trades at $0.0617 while showing some signals of a bullish recovery.
Technical indicators:
MACD indicator: With the bullish sprout at the support zone, the bearish histograms are on a decline. This increases the possibility of a bullish crossover.
RSI indicator: Falling sharply under the halfway line, the RSI line starts a small recovery phase.
Will DOGE Price Manage A Recovery?
With a recovery sprouting in the 4-hour chart, the chances of a bull cycle are minimal compared to a prolonged sideways trend. Therefore, the DOGE price may soon hit the overhead zone at $0.064 and elongate the consolidation range.
On the flip side, a downfall below $0.064 will plunge the DOGE price lower to the $0.050 psychological mark.
Read More