Bitcoin’s MVRV ratio shows LTHs move the market while STHs react

Share:
Predictions Markets
See what traders are focused on

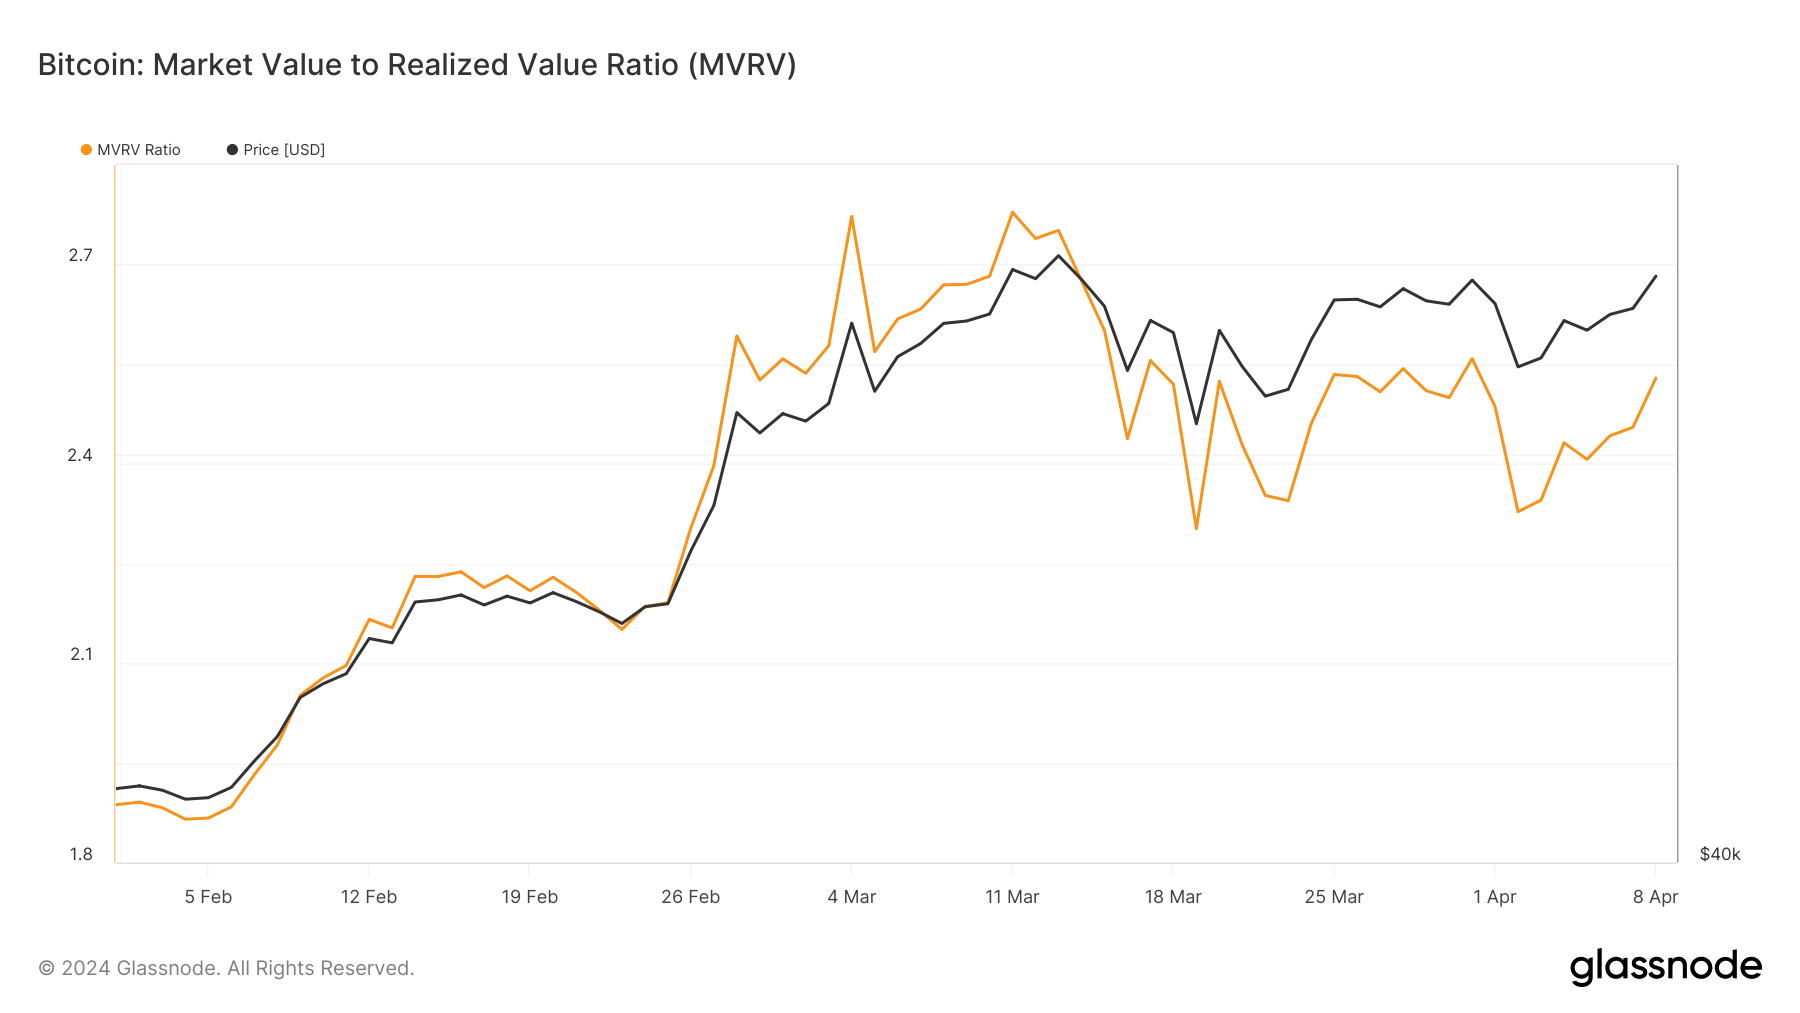
The market value to realized value (MVRV) ratio is one of the most important indicators for analyzing the Bitcoin market. It measures the ratio between the market cap (the current price of Bitcoin multiplied by the total number of coins in circulation) and the realized cap (the sum of the value of all coins in circulation at the price they were last moved).
While there are many uses for the MVRV ratio depending on which metric they’re analyzed with, it essentially provides insight into whether Bitcoin is undervalued or overvalued at a given time.
A higher MVRV ratio suggests that Bitcoin’s price is potentially overvalued, as it indicates the realized value is higher than the market value, which means investors are holding onto unrealized profits. An increase in unrealized profits leads to increased sell pressure as a significant portion of those investors are bound to capitalize on their gains.
Conversely, a lower MVRV ratio can indicate an undervalued market with minimal sell pressure, as investors aren’t holding unrealized gains. This ratio becomes even more important when applied to long-term holders (LTHs) and short-term holders (STHs), as the difference between their MVRV ratios can offer invaluable insights into market sentiment and future price movements.
CryptoSlate’s analysis of Glassnode data showed that changes in the MVRV ratio mirrored Bitcoin’s price volatility in the past six weeks. The ratio fluctuated alongside Bitcoin’s price, which peaked at $73,104 on Mar. 18 and was followed by volatility that saw it adjust down to $61,000 before finding footing at above $71,600 on April 8. The MVRV ratio peaked at 2.751 on March 13 as well.
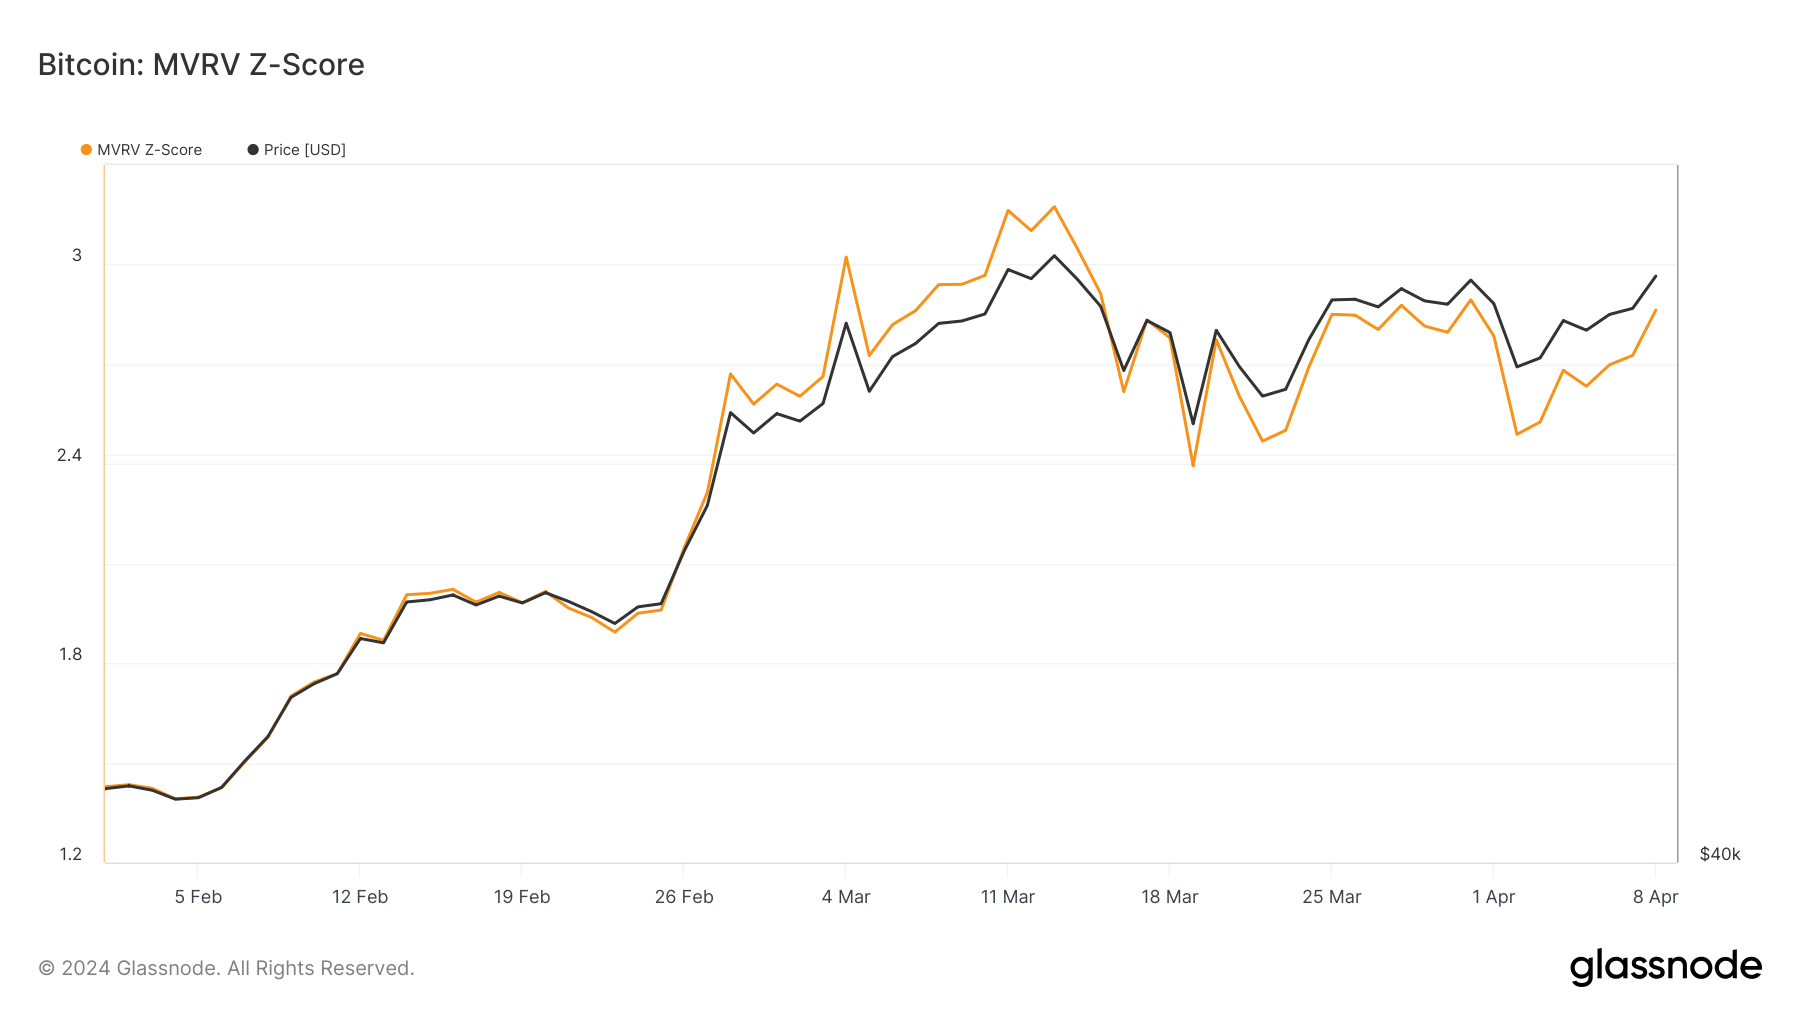
The MVRV ratio Z-score, which standardizes the MVRV ratio to identify extremes of market value compared to realized value, provides a clearer picture of the relationship between Bitcoin’s market cap and realized cap. With values peaking alongside both the MVRV ratio and Bitcoin’s price, it reinforces the notion of potential overvaluation at these points.
As both the general ratio and the Z-score decreased notably since their peak on March 13, it suggests the period saw increased speculative activity and profit-taking.
Diving deeper into the behavior of LTHs and STHs helps us understand which segment of the market saw the most unrealized profit.
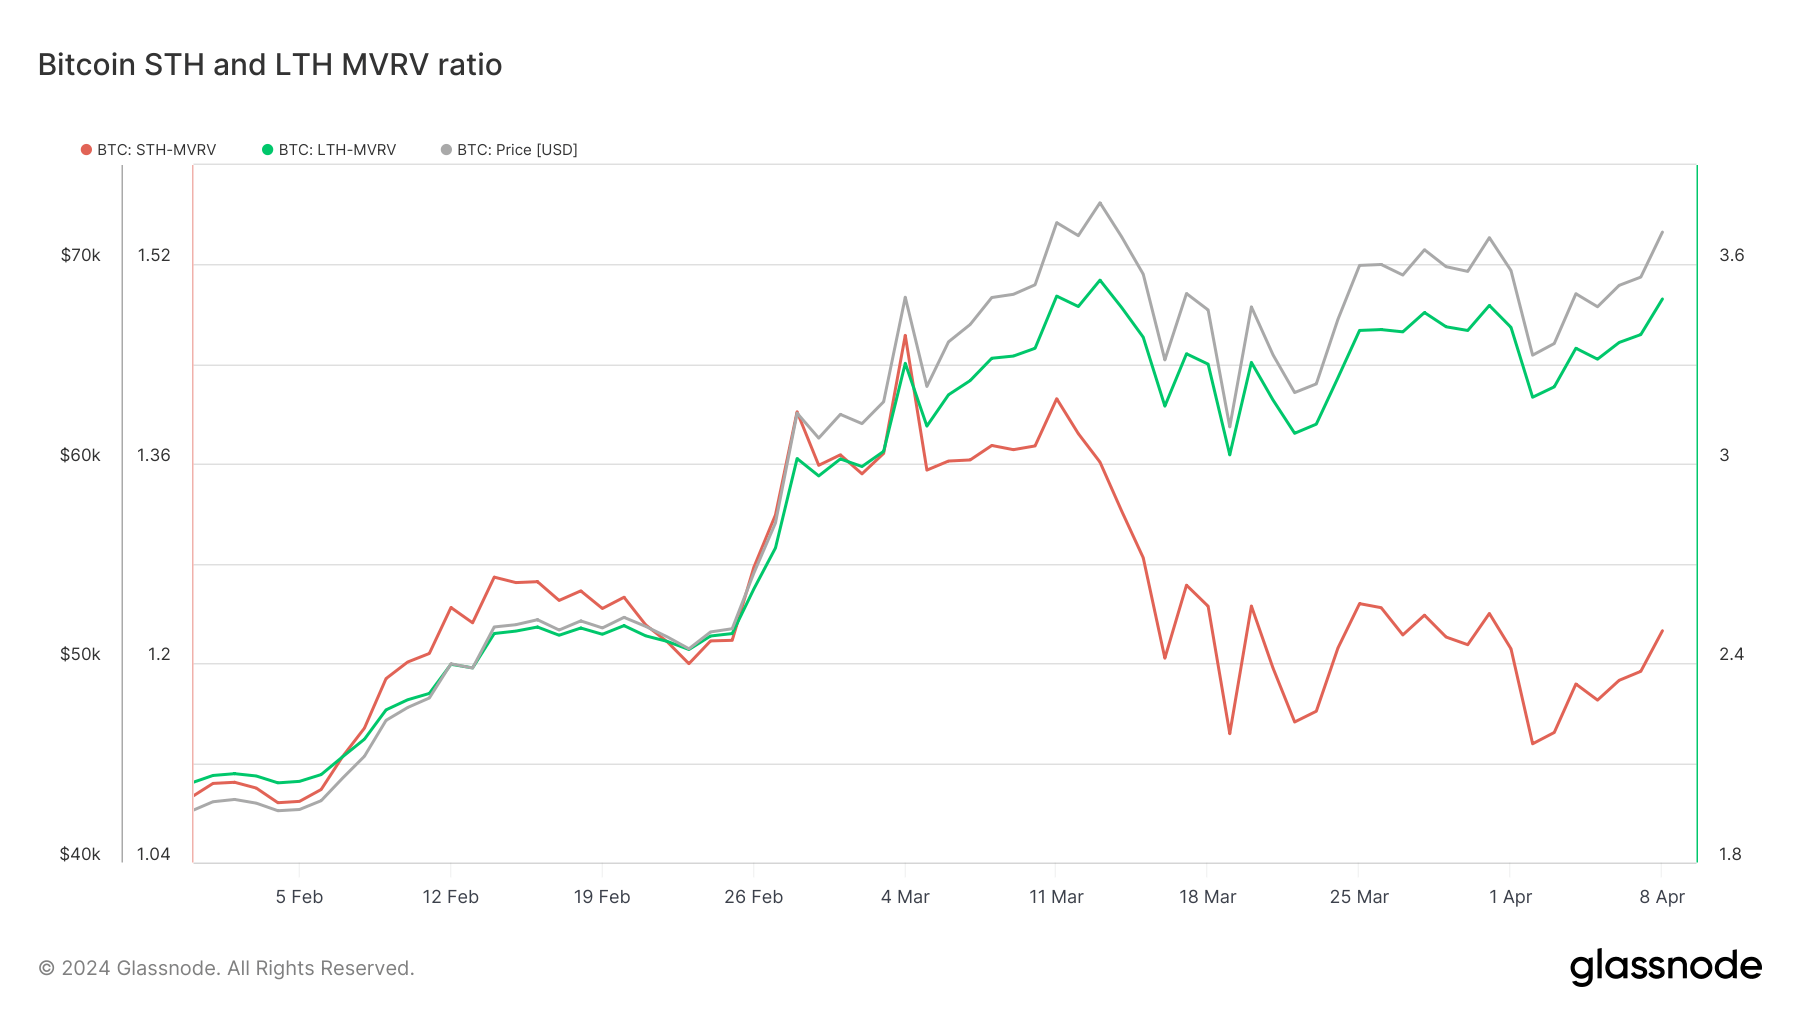
The LTH MVRV ratio was consistently higher than the general MVRV ratio, indicating that long-term holders were seeing substantially more unrealized profit compared to the market average. This is particularly noteworthy around March 13, when the LTH MVRV ratio reached 3.553, significantly higher than the general MVRV ratio of 2.751.
The disparity suggests that long-term holders could have been in a strong position to sell and realize profits, potentially contributing to subsequent price corrections. As of April 8, this disparity is still significant, showing the cohort’s realized value is significantly lower than the market value.
Conversely, the STH MVRV ratio remained notably lower than the general MVRV ratio throughout the period, reflecting that short-term holders were either at break even or experiencing minimal unrealized profits.
While this can be interpreted as STHs having less influence on the market’s direction, the cohort has seen consistent accumulation throughout this cycle and is responsible for increasing amounts of trading volume. This shows that despite their higher acquisition cost and lower unrealized profit, the sheer size of the cohort and the value it creates certainly have a significant impact on the market.
Glassnode’s data showed that the elevated LTH MVRV ratio created the potential for increased selling pressure during price peaks as long-term investors offload their holdings at very attractive profit-taking levels. When coupled with STHs’ minimal unrealized gains, this data indicates a market driven mainly by veteran investors’ actions and sentiment, with short-term holders playing a more reactive role.
Looking forward, the trends observed suggest a heightened sensitivity to shifts in long-term holder behavior. Should LTHs continue to hold despite high unrealized profits, it could signal a strong belief in further upside potential, potentially stabilizing the market during pullbacks.
However, significant sell-offs by this group could lead to sharp corrections, especially if accompanied by a rising general MVRV ratio and Z-score, indicating overvaluation.
The post Bitcoin’s MVRV ratio shows LTHs move the market while STHs react appeared first on CryptoSlate.


Read More

Bitcoin reclaims $64k – But Strategy’s $216mln underwater sale threatens momentum