Bitcoin Holds Near $96K as Key Indicators Signal Potential Volatility

Share:
Predictions Markets
See what traders are focused on

- Bitcoin (BTC) is currently trading at $95,895, down 0.93% in 24 hours.
- U.S. states like South Dakota and Utah show increasing Bitcoin adoption.
Bitcoin (BTC) is currently trading at $95,895.79, marking a 0.93% decline over the last 24 hours. The cryptocurrency hit a low of $95,685.71, with a 24-hour trading volume of $15.68 billion, reflecting a 65.45% decrease. The market cap remains at $1.9 trillion.
South Dakota and Utah are advancing plans to integrate Bitcoin into their state reserves. This reflects a growing trend of U.S. states adopting cryptocurrency as part of their financial strategies. Institutional investors are also focusing on Bitcoin, with anticipation of the upcoming halving event. BlackRock’s Bitcoin ETF continues to dominate inflows, reinforcing BTC’s long-term bullish outlook.
Will BTC Overcome Key Resistance?
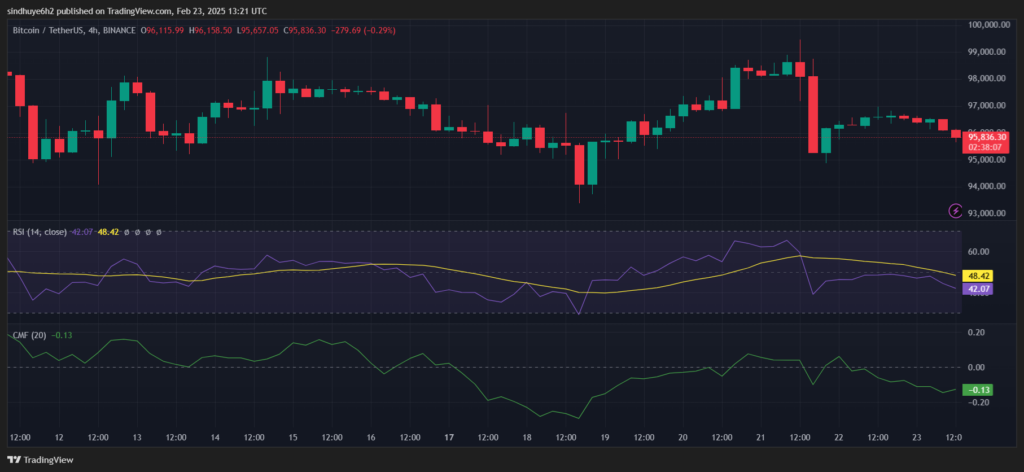
Bitcoin’s Relative Strength Index (RSI) stands at 42.07, below the neutral 50 mark, signalling a bearish sentiment. The RSI moving average is at 48.42, reinforcing the downward momentum. If the RSI moves below 40, Bitcoin could enter oversold territory, which might trigger a price rebound.
The Chaikin Money Flow (CMF) indicator is at -0.13, suggesting more capital outflows than inflows. This indicates weakening buying pressure, increasing the risk of further downside. A move into positive territory would suggest renewed accumulation by investors.
The 50-day moving average (MA) is trending above the current price, indicating that BTC is struggling to regain momentum. The 200-day MA remains strong, serving as long-term support. If Bitcoin can reclaim its short-term moving average, it could signal a potential reversal.
A bearish moving average crossover is forming, where shorter-term MAs are dipping below longer-term MAs. This suggests that Bitcoin may experience further price corrections before attempting a rally.
Bitcoin faces immediate resistance at $97,000. If BTC surpasses this level, it could test $100,000, driven by increased buying activity. On the downside, BTC has strong support at $95,000. A break below this could push the price toward $93,000, with further losses likely if selling pressure increases.
Bitcoin remains under pressure, with technical indicators pointing to potential downside risks. However, long-term fundamentals, including state-level adoption and ETF inflows, continue to support the market. BTC must break $97,000 to regain bullish momentum.
Highlighted Crypto News Today
Is MKR’s Golden Cross a Precursor to a Larger Breakout?
In This News
Coins

$ 64.14K
-0.38%
$ 1.40K
+3.25%
$ 33.38K

$ 0.000207

$ 0.000603


Predictions Markets
See what traders are focused on
Share:
In This News
Coins
$ 64.14K
-0.38%$ 1.40K
+3.25%$ 33.38K
$ 0.000207
$ 0.000603
Predictions Markets
See what traders are focused on
Share:
Read More

Bitcoin’s $64K rebound has three days before its next big challenge threatens to derail momentum