Bitcoin falls as ETF outflows spike: can bulls save $74K now?

Share:
Bitcoin has fallen more than 6% from last week’s $81,700 high to about $76,900 after breaking the $78,000 support, with the Crypto Fear & Greed Index at 28 and the 4-hour RSI near 32 indicating weakening momentum. Market-wide liquidations jumped 42% to nearly $661 million (BTC positions ~ $182M, ~$160M in longs) while US spot Bitcoin ETFs saw over $1 billion in net outflows last week (~13,000 BTC), and macro headwinds—US CPI 3.8%, PPI 6% and rising Treasury yields (30y 5.1%, 10y 4.6%, 2y 4.1%) plus oil around $110–$113—are increasing downside risk toward $76k then $74–75k unless BTC reclaims $78k–$80k.
Predictions Markets
See what traders are focused on

Bitcoin has fallen over 6% from last week’s high of $81,700 as fresh macro concerns have taken center stage.
As of last check, Bitcoin has lost a key support level at $78,000 and has pushed lower in tandem with accelerating market-wide liquidations.
At the same time, the crypto market sentiment tracked via the Crypto Fear and Greed Index has dropped to 28 from last week, once again entering ‘Fear’ territory after a brief return to neutral levels the previous week.
Why is Bitcoin price going down?
Bitcoin has come under renewed pressure due to a number of reasons that are keeping traders on edge.
The sell-off accelerated over the weekend after bulls failed to defend the $80,000 psychological support level.
Now, forced selling from overleveraged bullish traders is triggering automated sell orders across exchanges, leaving Bitcoin exposed as liquidity on the buy side weakened.
According to CoinGlass data, total crypto liquidations climbed 42% over the last 24 hours to nearly $661 million.
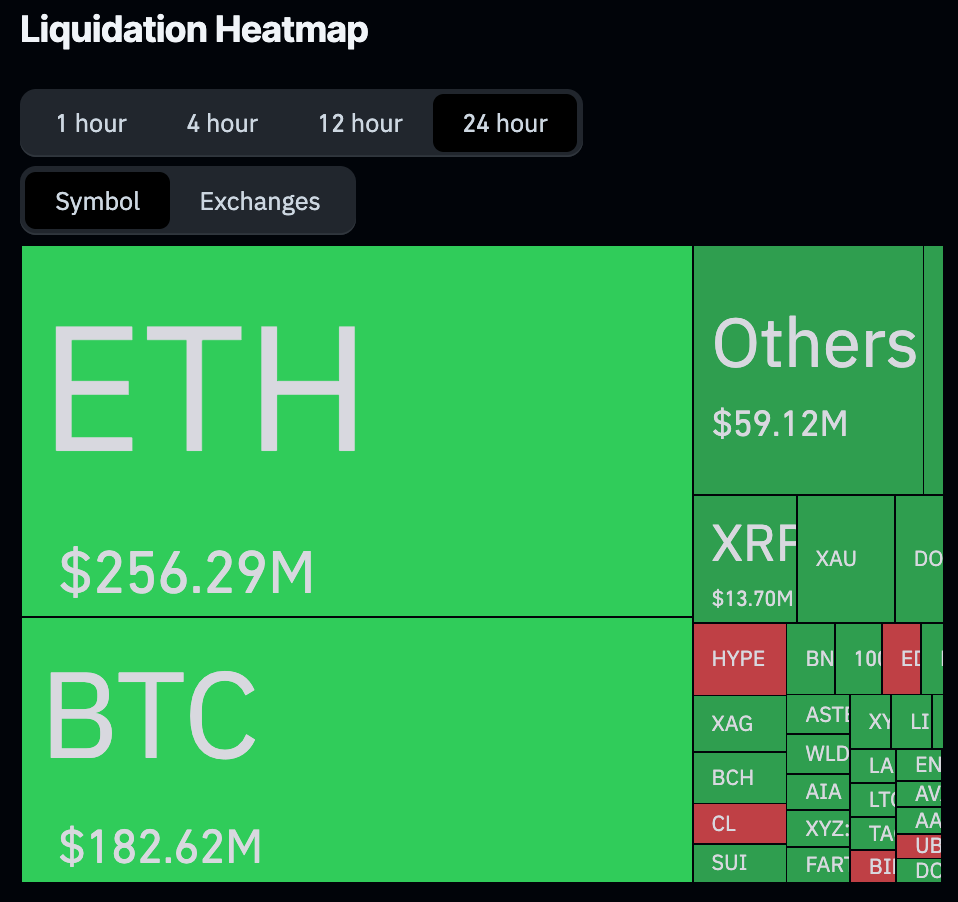
Crypto liquidations 24-hour. Source: Coinglass.
Bitcoin positions alone accounted for more than $182 million in liquidations, with over $160 million tied to long trades that were wiped out as prices rapidly moved lower.
Meanwhile, institutional flows have also started cooling after supporting Bitcoin’s recovery earlier this month.
Data compiled by SoSoValue showed US spot Bitcoin ETFs recorded more than $1 billion in net outflows last week, ending a multi-week stretch of consistent inflows.
Reports surrounding ETF activity also indicated that funds collectively shed close to 13,000 BTC within several trading sessions, signaling a slowdown in institutional accumulation.
Macroeconomic developments have only added to the concerns.
Recent US inflation data showed consumer inflation rising to 3.8%, while producer prices climbed 6%, strengthening expectations that the Federal Reserve may keep interest rates elevated for longer than previously anticipated.
Bond markets reacted quickly to the data.
US 30-year Treasury yields climbed to 5.1%, while the 10-year and 2-year yields moved to 4.6% and 4.1%, respectively.
Higher yields have historically weighed on Bitcoin and other speculative assets because tighter monetary conditions reduce investor appetite for risk.
At the same time, oil prices surged as geopolitical tensions in the Middle East intensified.
Brent crude climbed to around $113 per barrel, while West Texas Intermediate traded near $110 after renewed concerns surrounding possible military escalation involving Iran, Israel, and the United States.
Some market observers believe the renewed spike in crude prices has amplified inflation concerns while driving capital away from high-risk assets such as Bitcoin and toward traditional safe havens, including gold and short-term US Treasuries.
Pressure on Bitcoin also intensified as the US Dollar Index moved back toward the 101 level. A stronger dollar typically tightens global liquidity conditions and tends to weigh on cryptocurrencies.
Bitcoin price analysis
According to the 4-hour BTC/USD price chart, Bitcoin price has now slipped below all three major short-term exponential moving averages, a sign that bearish momentum has started overpowering the recovery structure that carried the asset above $82,000 earlier this month.
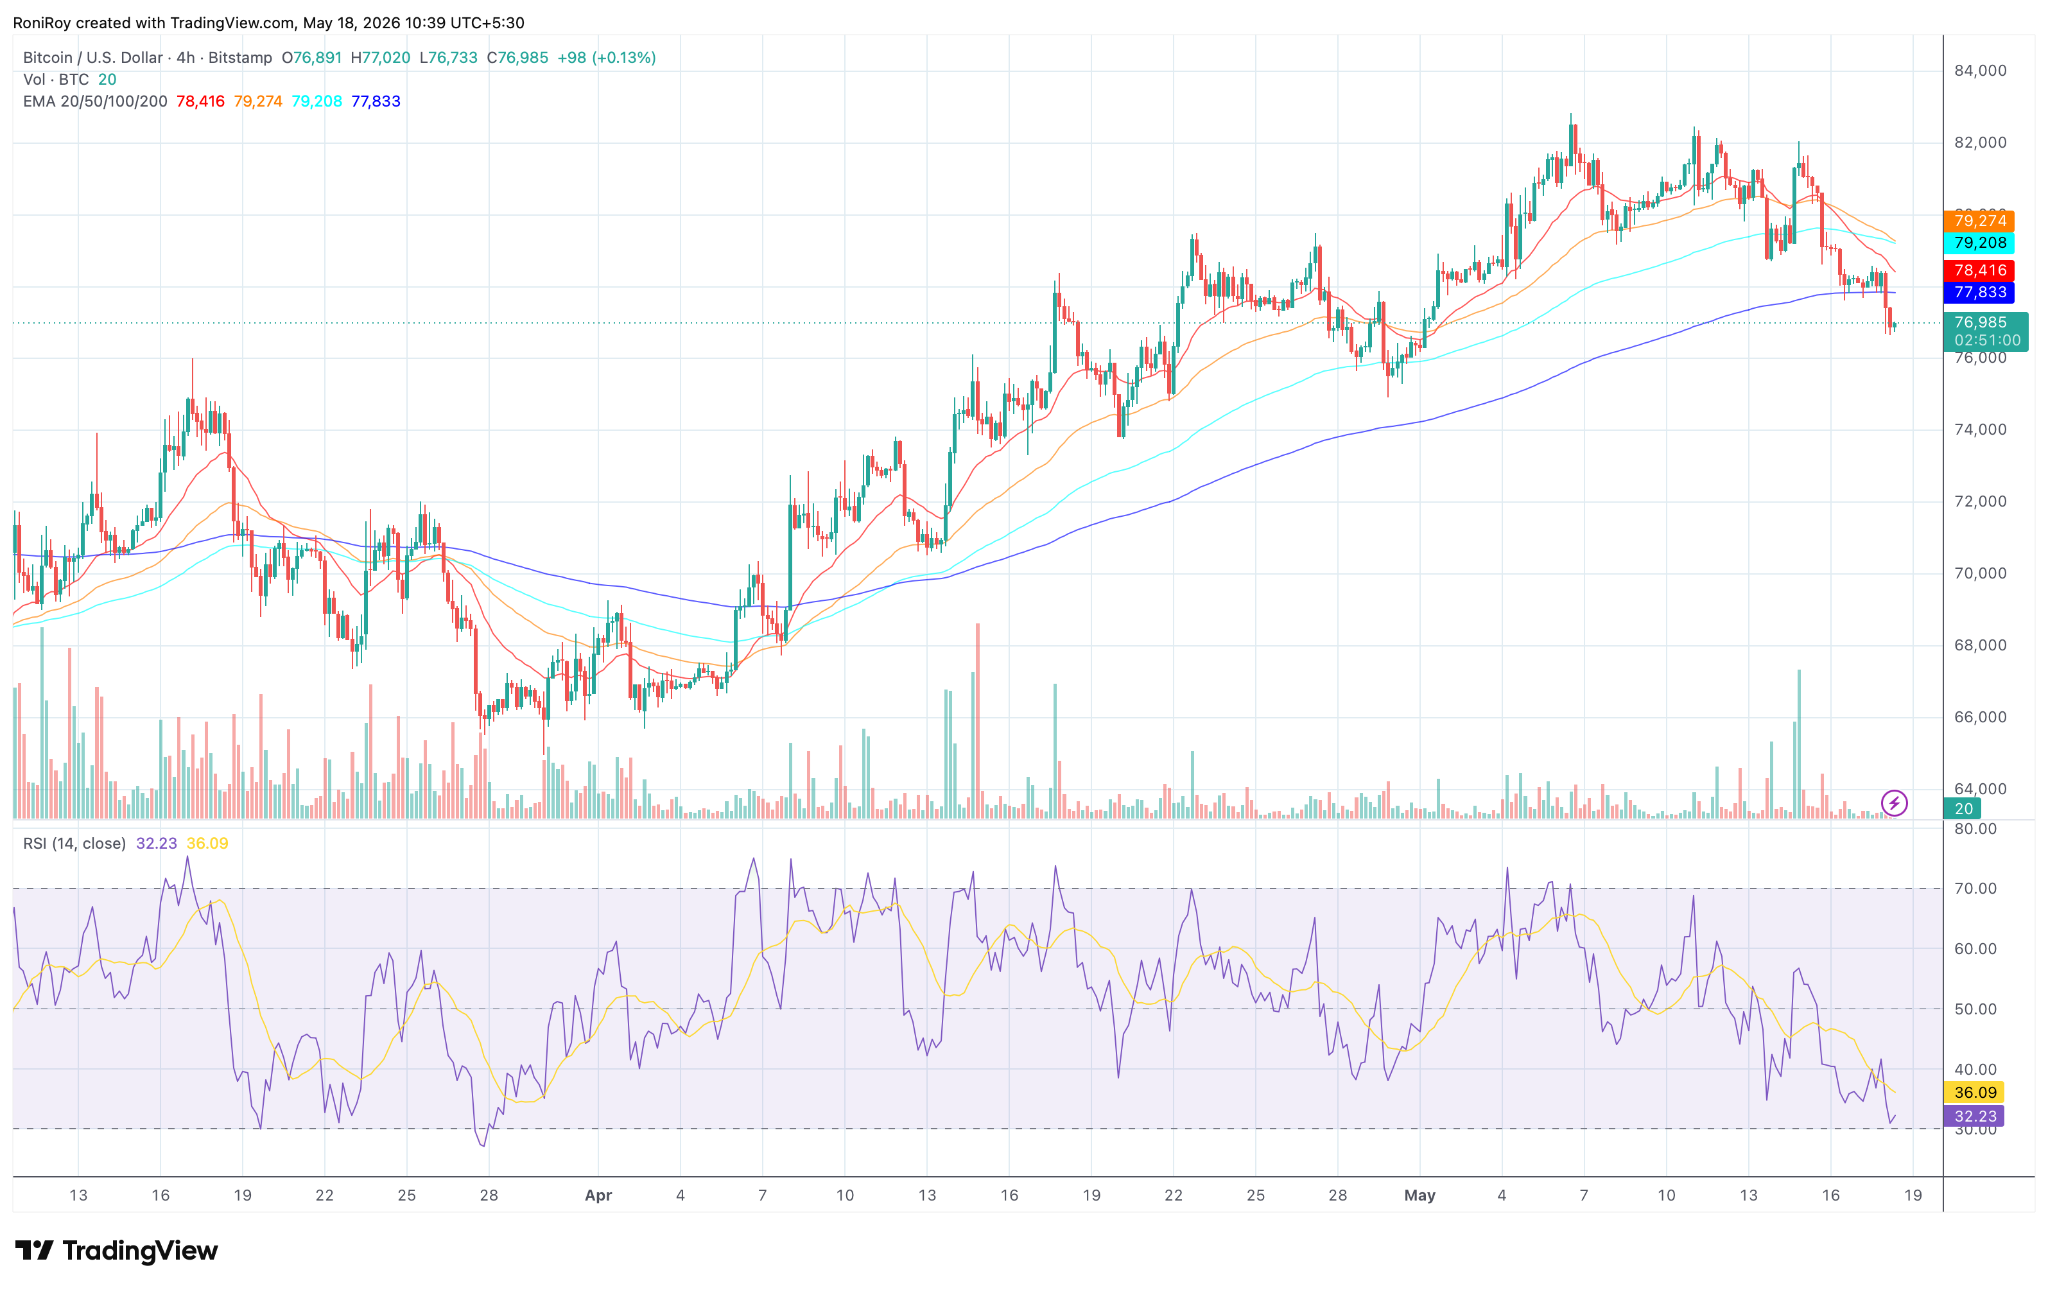
BTC/USD 4-hour price chart. Source: TradingView.
At the time of writing, Bitcoin was trading near $76,900 after breaking beneath the 20 EMA at $78,416, the 50 EMA at $79,274, and the 100 EMA at $79,208.
Losing all three levels within a short period has weakened the short-term market structure and placed sellers back in control.
Meanwhile, the 200 EMA near $77,833 is also starting to lose strength as support after Bitcoin briefly moved below it during the latest sell-off.
Traders often watch the 200 EMA closely because sustained trading below that level can indicate that bullish momentum is fading on higher timeframes.
The Relative Strength Index, or RSI, has also continued sliding lower.
On the 4-hour chart, RSI has dropped to around 32, pushing close to oversold territory after remaining near overbought conditions earlier this month during Bitcoin’s rally toward $82,000.
Falling RSI levels alongside declining price action typically point to weak buying momentum.
At the same time, the indicator has not yet shown a strong bullish divergence, suggesting sellers may still have room to pressure prices lower before a meaningful relief bounce develops.
Volume activity has also picked up during the recent decline, particularly around large red candles near the breakdown below $78,000.
Rising sell-side volume during a support breakdown often signals panic-driven exits and forced liquidations rather than controlled profit taking.
From a price structure perspective, Bitcoin now risks revisiting the $76,000 zone, which acted as a temporary intraday support during the latest liquidation cascade.
If it fails to hold, traders could begin watching the $74,000 to $75,000 region next, an area where Bitcoin previously found support during late April consolidation.
On the upside, Bitcoin would first need to reclaim the $78,000 level before bulls can attempt another push toward the 100 EMA and 50 EMA cluster near $79,200 to $79,300.
A stronger recovery would likely require Bitcoin to move back above the $80,000 psychological level, where heavy selling pressure recently emerged.
The post Bitcoin falls as ETF outflows spike: can bulls save $74K now? appeared first on Invezz


Read More

Bitcoin’s short-term holders remain 15% underwater—but selling pressure is easing