ETH Price Analysis: What Does the $2K Rejection Mean for Ethereum’s Future?
Share:
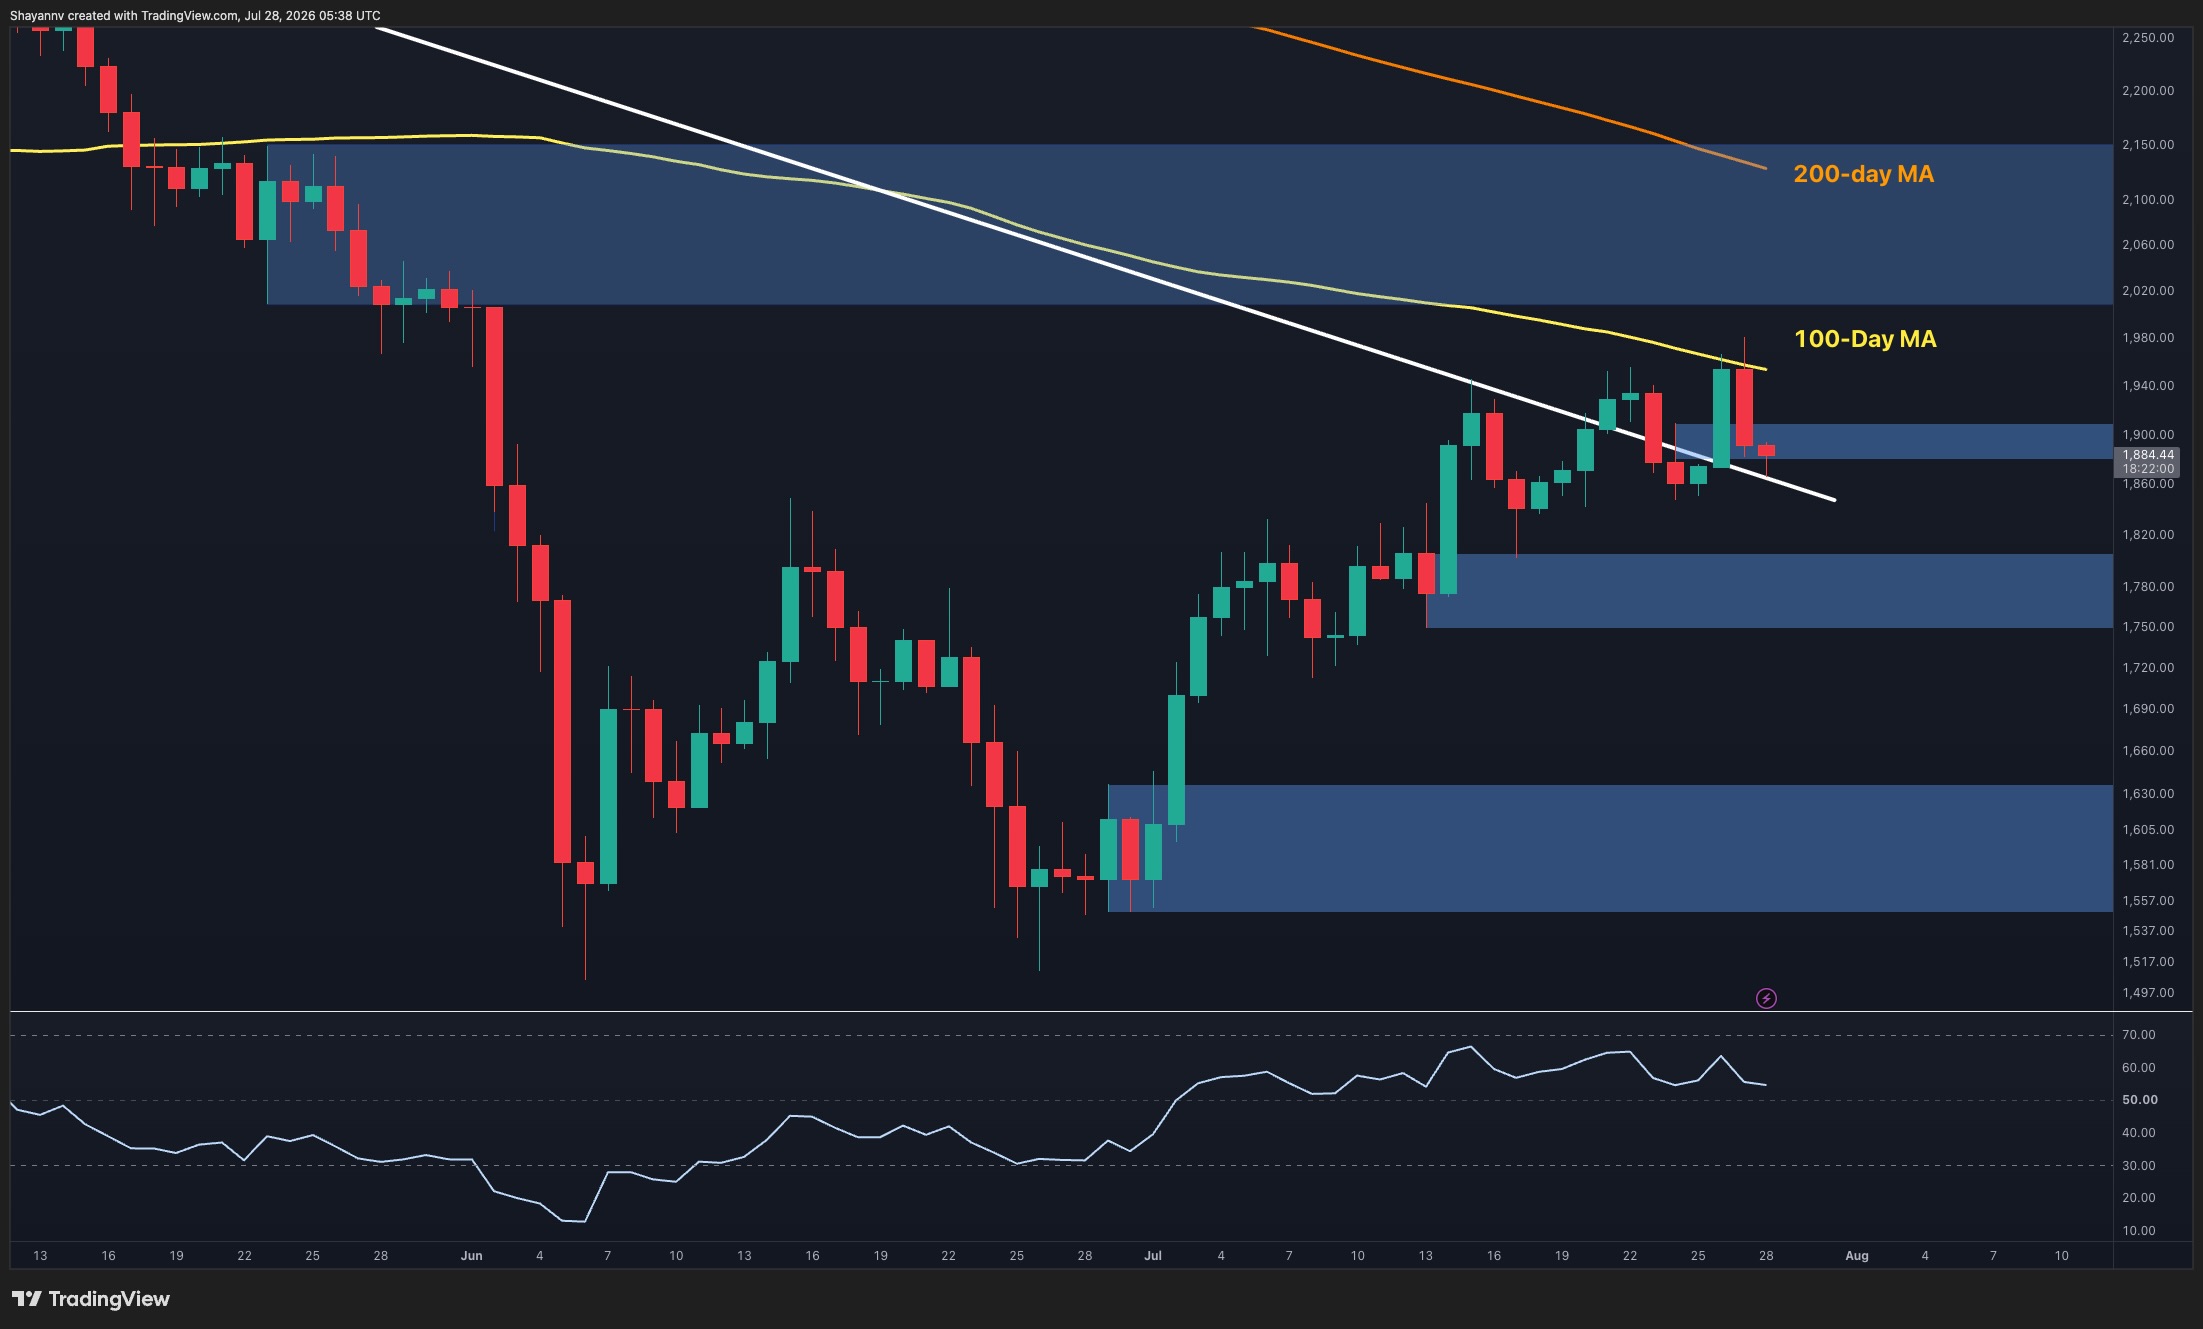
Ethereum has paused beneath a key resistance zone between $2,000 and $2,150, compressing while still holding higher lows after a recovery from the June lows. Rejection at the 100-day moving average reinforces selling pressure and leaves the broader bearish structure intact, making a breakout or breakdown the likely next catalyst for crypto traders, DeFi users and market participants.
Predictions Markets
See what traders are focused on

Ethereum has paused after its recent recovery, with the price action compressing beneath a key resistance area while still holding above higher lows. The current structure suggests that the market is approaching an inflection point where the next breakout or breakdown could determine the short-term direction.
Ethereum Price Analysis: The Daily Chart
On the daily timeframe, ETH remains below the long-term resistance zone between $2K and $2.15K, where the 100-day moving average continues to reinforce selling pressure. Although buyers managed to recover strongly from the June lows, the latest rejection near the 100-day MA highlights that the broader bearish structure has not yet been invalidated.
In This News
Coins

$ 1.92K
-0.59%
$ 1.92K
-0.07%Predictions Markets
See what traders are focused on
Share:
In This News
Coins
$ 1.92K
-0.59%$ 1.92K
-0.07%Predictions Markets
See what traders are focused on
Share:
Read More
Ethereum Price Analysis: ETH Hits a Decision Point as Major Resistance Comes Into Play