Ethereum Price Analysis: ETH Hits a Decision Point as Major Resistance Comes Into Play
Share:
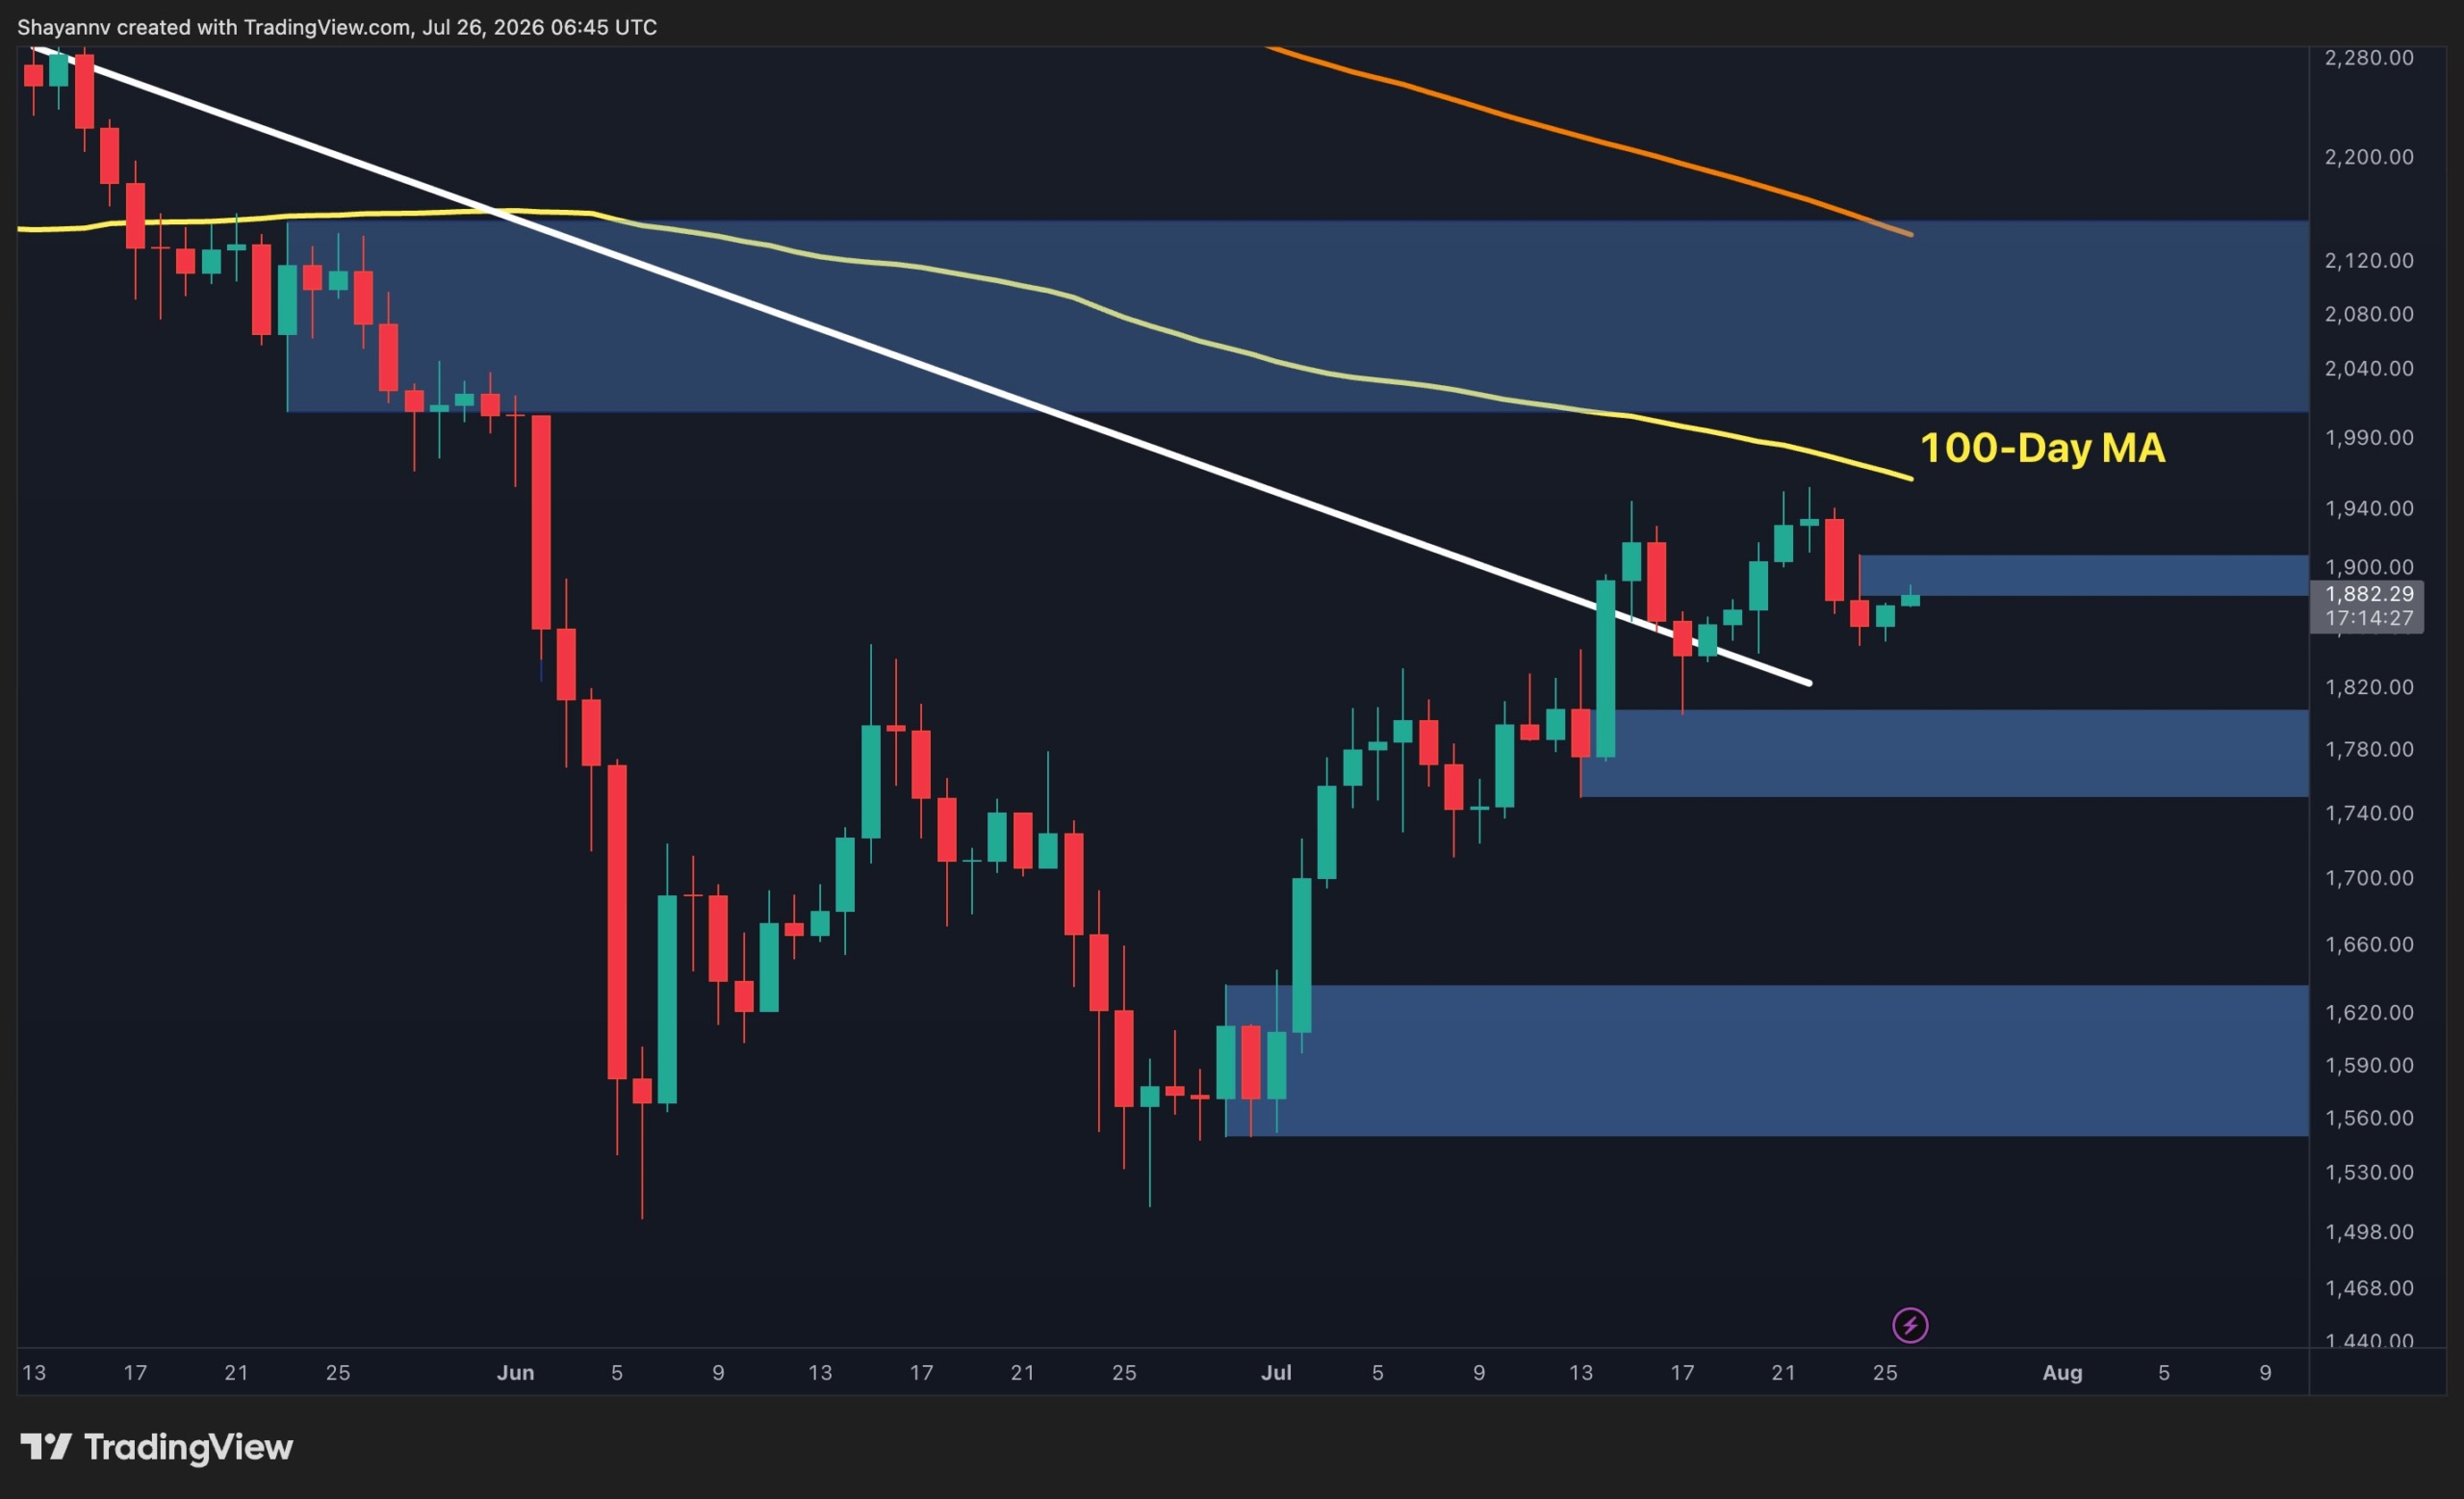
Ethereum has rebounded from its local bottom and is testing key resistance levels, with upcoming sessions set to reveal whether this recovery has enough momentum to continue. On the daily chart ETH is holding above a previously broken descending trendline, printing higher highs and higher lows and consolidating above the $1.76K to $1.82K support region, a technical improvement positive for token performance, DeFi activity and broader crypto adoption.
Predictions Markets
See what traders are focused on

After staging an impressive rebound from its local bottom, Ethereum is beginning to test increasingly important resistance levels. The coming sessions should provide more clarity on whether this recovery has enough momentum to continue.
Ethereum Price Analysis: The Daily Chart
The daily chart shows ETH holding above the previously broken descending trendline, confirming that the medium-term structure has improved compared to the aggressive selloff seen in June. Following the breakout, the market has successfully established a sequence of higher highs and higher lows while consolidating above the $1.76K to $1.82K support region.
In This News
Coins

$ 1.90K
+1.67%
$ 1.89K
+1.19%Predictions Markets
See what traders are focused on
Share:
In This News
Coins
$ 1.90K
+1.67%$ 1.89K
+1.19%Predictions Markets
See what traders are focused on
Share:
Read More
Ethereum Price Prediction: Where Is ETH Headed After the $1,950 Rejection?