Blockchain Performance Report: A Monthly Insight into TVL and Market Dynamics
Share:
Predictions Markets
See what traders are focused on

The post Blockchain Performance Report: A Monthly Insight into TVL and Market Dynamics appeared first on Coinpedia Fintech News
The blockchain sector is booming and no longer just a futuristic tech concept – it is today’s technology. For tech enthusiasts to thrive in this fast-paced, competitive world, a clear understanding of every development in the industry is crucial.
This monthly report simplifies blockchain analysis, offering a straightforward overview of the sector’s latest developments. Using high-quality data ensures the utmost clarity in this exploration. Let’s dive into the report to stay updated on the rapidly transforming blockchain landscape and to remain informed about all the major trends that the data collected for the month recognizes.
1. Blockchain Performance: A General Analysis
A primary analysis of the performance of a blockchain for a particular month can be done using Total Value Locked.
The total Value Locked in a blockchain’s decentralized finance ecosystem reflects the aggregate value of assets locked in smart contracts. A rising TVL indicates adoption, economic activity, and user trust, suggesting a positive month of robust DeFi participation, enhancing the overall performance of the blockchain.
1.1. Blockchain Performance Analysis Using TVL and Dominance
Here are the top ten blockchains based on the overall TVL and Dominance data:
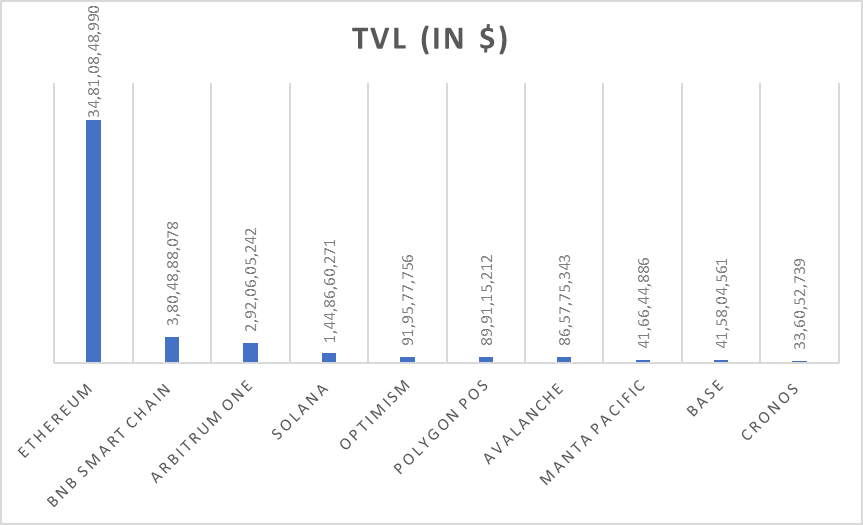
| No. | Blockchain | TVL | Dominance |
| 1 | Ethereum | $34,810,848,990 | 72.49% |
| 2 | BNB Smart Chain | $3,804,888,078 | 7.92% |
| 3 | Arbitrum One | $2,920,605,242 | 6.08% |
| 4 | Solana | $1,448,660,271 | 3.02% |
| 5 | Optimism | $919,577,756 | 1.91% |
| 6 | Polygon POS | $899,115,212 | 1.87% |
| 7 | Avalanche | $865,775,343 | 1.80% |
| 8 | Manta Pacific | $416,644,886 | 0.87% |
| 9 | Base | $415,804,561 | 0.87% |
| 10 | Cronos | $336,052,739 | 0.70% |
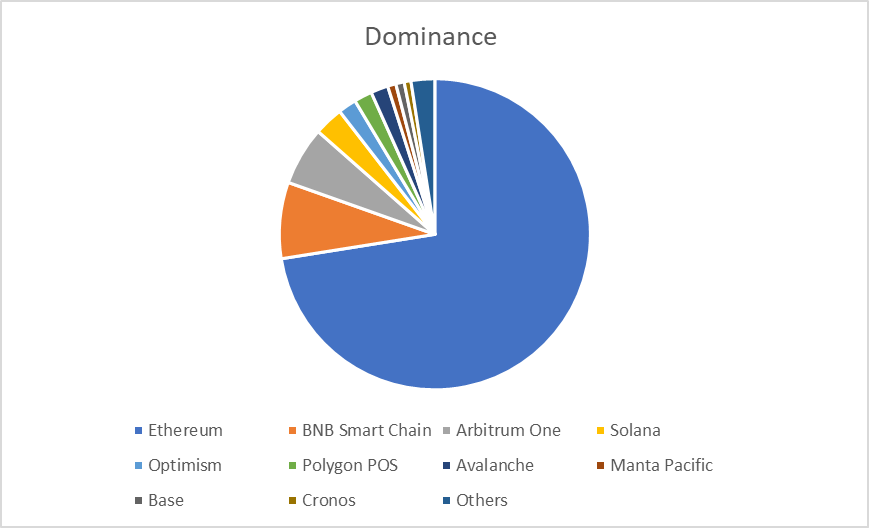
The blockchain performance analysis based on Total Value Locked (TVL) and Dominance reveals Ethereum’s significant lead, commanding a TVL of $34.81 billion, constituting a dominant 72.49%. BNB Smart Chain follows with $3.80 billion and a 7.92% share. Arbitrum One and Solana secure the third and fourth positions, respectively, with TVLs of $2.92 billion (6.08%) and $1.45 billion (3.02%).
Optimism, Polygon POS, Avalanche, Manta Pacific, and Base contribute to the ecosystem, each with TVLs ranging from $919 million to $415 million and dominance percentages from 1.91% to 0.87%. Among the top ten contestants is Cronos trails with a TVL of $336 million and 0.70%.
1.1.1. Analysing Top Blockchains Using 30-Day TVL Movement
Let’s re-analyse the top blockchains, which dominate the blockchain sector in terms of the YTD TVL data, with the 30-Day TVL movement data to know how much movement the top chains have witnessed in the last 30 days.
| No. | Blockchain | 30-Day Movement (in %) |
| 1 | Ethereum | 19.6% |
| 2 | BNB Smart Chain | 13.6% |
| 3 | Arbitrum One | 14.6% |
| 4 | Solana | 24.4% |
| 5 | Optimism | 4.9% |
| 6 | Polygon POS | 0.6% |
| 7 | Avalanche | -9.2% |
| 8 | Manta Pacific | 880.2% |
| 9 | Base | -2.2% |
| 10 | Cronos | Nil |
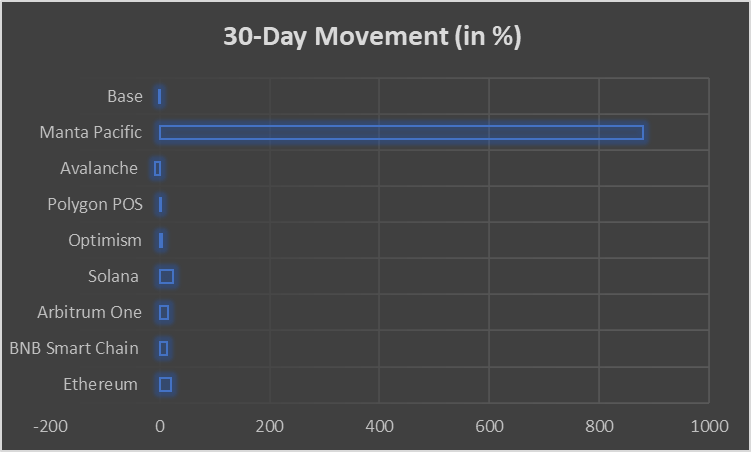
Re-analyzing the top blockchains based on their 30-day Total Value Locked movement provides valuable insights into their performance. It unveils nuanced patterns, with Solana and Ethereum leading positively, while outliers like Mata Pacific raise intriguing questions about emerging players in the blockchain landscape.
Ethereum, a pioneer, stands at 19.6%, reflecting consistent growth. MantaPacefic’s staggering 880.2% surge raises eyebrows, demanding an in-depth exploration of the factors driving such unprecedented growth.
Solana’s remarkable 24.4% surge indicates increasing interest and adoption. BNB Smart Chain, at 13.6%, showcases steady development, while Arbitrum One and Optimism at 14.6% and 4.9%, respectively, suggest a positive trend in layer 2 solutions. Surprisingly, Polygon POS displays a minimal 0.6% movement, emphasising its stable position.
Contrastingly, Avalanche records a -9.2% decline, prompting scrutiny into potential challenges affecting its TVL. Likewise, Base’s -2.2% dip may also hint at underlying issues requiring attention.
1.2. Blockchain Monthly Performance Analysis Using 30-Day TVL Movement
Let’s see how things will appear when we do the performance analysis solely based on the 30-day TVL movement date.

| No. | Blockchain | 30-Day Movement |
| 1 | Manta Pacific | 886.3 |
| 2 | opBNB | 193.3 |
| 3 | Sei Network | 161.1 |
| 4 | Metis Andromeda | 122.3 |
| 5 | Ronin | 26.3 |
| 6 | Solana | 23.7 |
| 7 | StarNet | 22.8 |
| 8 | Ethereum | 19.2 |
| 9 | Arbitrum One | 14.0 |
| 10 | BNB Smart Chain | 13.1 |
The recent 30-day Total Value Locked (TVL) movement across various blockchain reveals intriguing insights into the dynamics of the blockchain space. Let’s delve into the notable performers and their respective drivers.
Manta Pacific experienced an extraordinary 886% surge in TVL, primarily attributed to its strategic New Paradigm campaign. Launched in December 14, last year, the campaign rewarded users who bridged Ethereum to Manta Pacific, offering ‘box pieces’ as incentives. Users accumulating 25 pieces were eligible for a non-fungible token (NFT).
The TVL peaked in mid-January, showcasing the campaign’s success. However, a potential decline post-mid-January is anticipated as users claim rewards, hinting that some participants might have been solely motivated by the airdrop. This is indicative of a scenario where investors may have engaged with Manta Pacific for short-term gains rather than long-term commitment.
opBNB demonstrated a notable 193.3% increase in TVL, driven by factors such as the BNB Chain’s TVL Incentive Program. This program encouraged DeFI projects to boost their TVL on opBNB, contributing the platform’s substantial growth. The incentive-driven approach seems effective in attracting projects and capital to the platform, highlighting the importance of strategic programmes in influencing TVL.
Sei Network observed a significant 161% increase in TVL, attributed to the impending Sei V2 upgrade scheduled for 2024. This upgrade promises substantial enhancements, including optimistic parallelization and EVM compatibility. Sei’s technical superiority and support from reputable venture capitalists indicate strong investor confidence. The surge in the liquid staking token, SEILOR, and the dominance of Astroport in the Sei-based applications market further affirm the network’s growth.
Metis Andromeda experienced a 122.3% growth, owing to a few important developments. MetisDAO Foundation’s Metis Andromeda showcases a strategic move by establishing a $110 million Ecosystem Development Fund. This fund, allocating 4.6 million METIS tokens, supports various activities, including sequencer mining and new project development.
The decentralization of Metis’s sequencer is a key development, potentially improving network efficiency and transparency. Investors see this move as a positive factor for Metis’s growth. The association with Natalia Ameline, a team member and the mother of Ethereum co-founder Vitalik Buterin, adds an interesting dimension to Metis’s story.
Apart the top four, which experienced commendable growth, Ronin, Solana, StarkNet, Ethereum, Arbitrum One, and BNB Smart Chain also witnessed noteworthy TVL increases, ranging from 13.1% to 26.3%. As a foundational player, Ethereum showed a 19.2% increase, reflecting its sustained relevance in the market.
In short, the 30-day TVL movement data reflects diverse strategies across different blockchain networks, ranging from incentive programs to technical upgrades. While short-term motivations, like airdrops, can drive rapid TVL increases, sustained growth is likely to be influenced by a combination of strategic initiatives, technical advancements, and market positioning.
2. Blockchain Comparative Analysis: How Top Blockchains Performed This Month
By focusing on four analysis factors, you can gain insights into each blockchain’s economic strength, development activity, market stability, and adoption potential.
2.1. Blockchain Analysis: Total Value Locked and Economic Activity
Let’s assess the economic activity within each blockchain’s ecosystem. A higher TVL, transaction volume, and revenue may indicate a more vibrant and utilized blockchain.
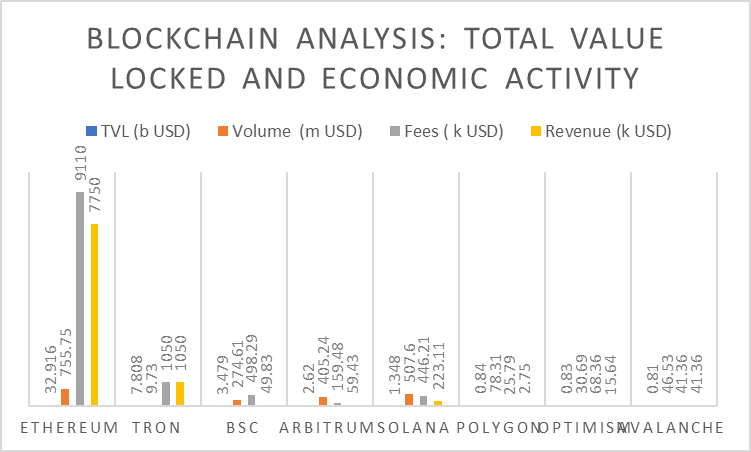
| Blockchains | TVL | Volume | Fees | Revenue |
| Ethereum | 32.916b USD | 755.75m USD | 9.11m USD | 7.75m USD |
| Tron | 7.808b USD | 9.73m USD | 1.05m USD | 1.05m USD |
| BSC | 3.479b USD | 274.61m USD | 498.29k USD | 49.83k USD |
| Arbitrum | 2.62b USD | 405.24m USD | 159.48k USD | 59.43k USD |
| Solana | 1.348b USD | 507.6m USD | 446.21k USD | 223.11k USD |
| Polygon | 845.18m USD | 78.31m USD | 25.79k USD | 2.75k USD |
| Optimism | 836.68m USD | 30.69m USD | 68.36k USD | 15.64k USD |
| Avalanche | 810.87m USD | 46.53m USD | 41.36k USD | 41.36k USD |
Ethereum dominates the blockchain landscape with a Total Value Locked (TVL) of 32.92 billion USD, reflecting its significant user engagement. Ethereum’s high transaction volume of 755.75 million USD and substantial fees of 9.11 million USD underscore its robust economic activity. The notable revenue of 7.75 million USD further solidifies its position as a thriving blockchain among the prominent blockchains in the market.
Tron follows with a TVL of 7.81 billion USD, showcasing substantial user participation. Despite a lower transaction volume and fees than Ethereum, Tron’s revenue matches its fees, indicating efficiency in monetization.
Binance Smart Chain (BSC) and Arbitrum exhibit lower TVLs but demonstrate considerable economic activity. BSC’s transaction volume and revenue outpace Arbitrum, showcasing diverse use cases.
Despite a TVL of 1.35 billion USD, Solana boasts an impressive transaction volume and revenue, reflecting a highly active ecosystem.
Polygon, Optimism, and Avalanche exhibit lower TVLs, yet their transaction volumes and revenues suggest growing utility, especially considering Avalanche’s notable efficiency in revenue generation.
In short, Ethereum is a leader in TVL and economic activity, while other blockchains, despite varying TVLs, showcase vibrancy through transaction volumes and revenues.
2.2. Blockchain Analysis: Development and Innovation
Let’s evaluate the development activity and innovation within each blockchain. A blockchain with a strong development community, active core developers, and more commits may suggest ongoing improvement and evolution.
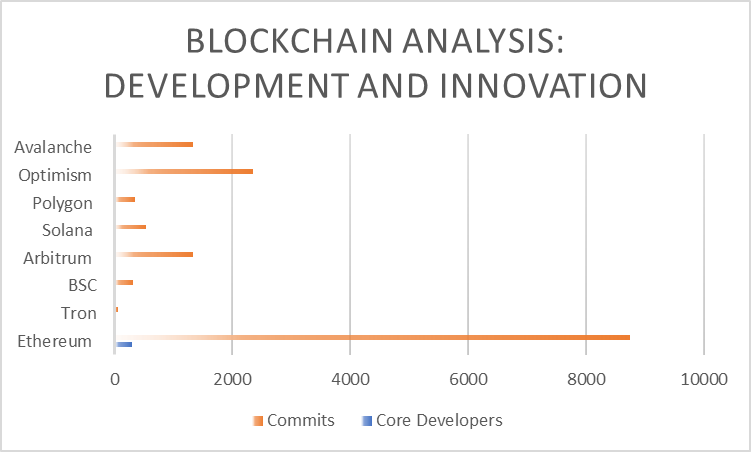
| Blockchains | Core Developers | Commits |
| Ethereum | 305 | 8.74k |
| Tron | 9 | 56 |
| BSC | 29 | 314 |
| Arbitrum | 36 | 1.33k |
| Solana | 35 | 543 |
| Polygon | 20 | 345 |
| Optimism | 36 | 2.35k |
| Avalanche | 33 | 1.34k |
Ethereum leads the blockchain space with a robust development community, boasting 305 core developers and a substantial 8.74k commits. This signifies a high level of ongoing innovation and improvement. Tron, with nine core developers and 56 commits, and Binance Smart Chain (BSC), with 29 developers and 314 commits, show moderate levels of development activity.
Arbitrum, Solana, and Avalanche display active development with 36, 35, and 33 core developers, respectively, coupled with a commendable number of commitments.
Optimism with 36 developers and an impressive 2.35k commits, reflects a dynamic and highly innovative environment.
Polygon, despite a comparatively smaller core developer count, maintains a solid commitment to development with 20 developers and 345 commits.
2.3. Blockchain Analysis: Market Performance and Stability
Let’s analyze the market performance and stability of each blockchain’s native cryptocurrency. The prevalence and usage of stablecoins within the ecosystem can measure stability and potential as a medium of exchange.
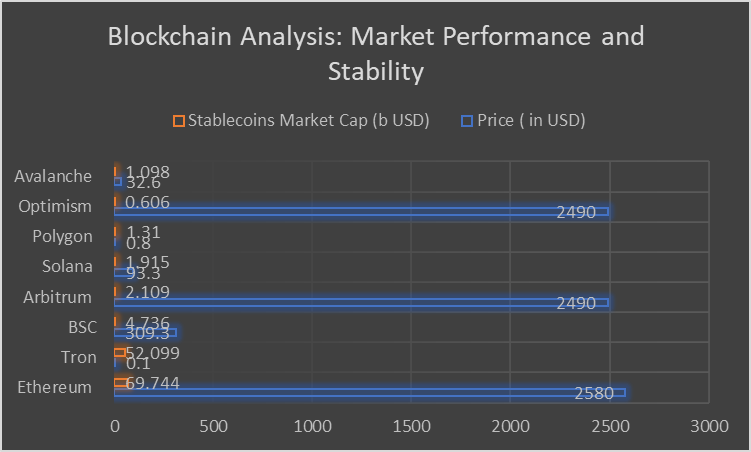
| Blockchains | Price | Stablecoins Market Cap |
| Ethereum | 2.58k USD | 69.744b USD |
| Tron | 0.1 USD | 52.099b USD |
| BSC | 309.3 USD | 4.736b USD |
| Arbitrum | 2.49k USD | 2.109b USD |
| Solana | 93.3 USD | 1.915b USD |
| Polygon | 0.8 USD | 1.31b USD |
| Optimism | 2.49k USD | 606.29m USD |
| Avalanche | 32.6 USD | 1.098b USD |
Among the leading blockchains analyzed, Ethereum stands out with a substantial market price of USD 2.58k and a considerable market cap of USD 69.744 billion. Its robust performance signifies its dominance and reliability. Despite having a lower individual token value at USD 0.1, Tron boasts a significant Stablecoins Market Cap of USD 52.099 billion, indicating its widespread usage for stable transactions.
Binance Smart Chain holds a relatively high token value of USD 309.3, but a stablecoins market cap of USD 4.736 billion suggests a smaller footprint in stablecoin transactions. Arbitrum and Optimism, both Ethereum layer 2 solutions, showcase similar token values at USD 2.49k. Still, Arbitrum has a higher stablecoins market cap of $2.109 billion, showcasing its stability and potential for widespread adoption.
Solana, Polygon, and Avalanche exhibit comparatively lower token values but vary in stablecoins market cap. Solana, at USD 93.3, holds a stablecoins market cap of USD 1.915 billion, while Polygon, valued at USD 0.8, has a market cap of USD 1.31 billion. Avalanche, priced at USD 32.6, demonstrates stability with a market cap of $1.098 billion.
2.4. Blockchain Analysis: Adoption and User Interest
Let’s examine the level of adoption and user interest by looking at inflows, coin prices, and market capitalization. A blockchain with increasing user interest and growing market capitalization may indicate a higher level of adoption.
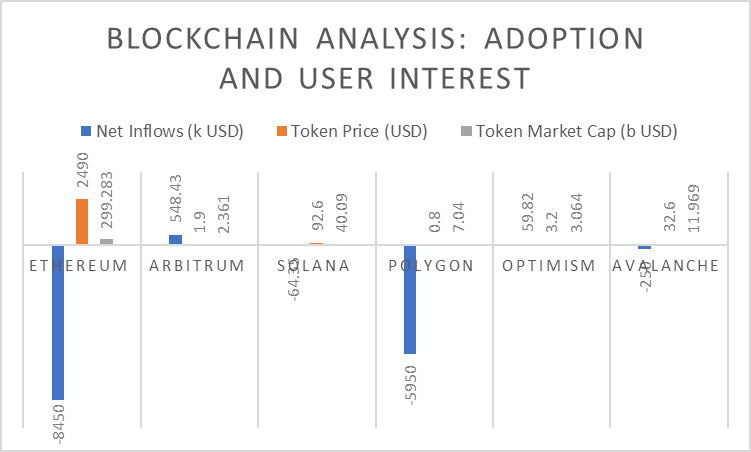
| Blockchains | Net Inflows | Token Price | Token Market Cap |
| Ethereum | -8.45m USD | 2.49k USD | 299.283b USD |
| Tron | N/A | 0.1 USD | 9.739b USD |
| BSC | 548.53k USD | N/A | N/A |
| Arbitrum | 548.43k USD | 1.9 USD | 2.361b USD |
| Solana | -64.35k USD | 92.6 USD | 40.09b USD |
| Polygon | -5.95m USD | 0.8 USD | 7.04b USD |
| Optimism | 59.82k USD | 3.2 USD | 3.064b USD |
| Avalanche | -0.25m USD | 32.6 USD | 11.969b USD |
Ethereum leads in user interest and adoption, with a significant Net Inflow of -8.45 million USD, a high token price of 2.49k USD, and an impressive market cap of 299.283 billion USD. Despite a negative net inflow, the substantial token value and market cap showcase strong community engagement and trust.
Arbitrum follows with a positive Net Inflow of 548.43k USD, a moderate token price of 1.9 USD, and a market cap of 2.361 billion USD. The positive net inflow suggests increasing interest and investment, indicating potential growth.
Tron, with a token price of 0.1 USD and a market cap of 9.739 billion USD, demonstrates a lower token value than some of its close contestants. However, its substantial market cap suggests a considerable user base and adoption. Meanwhile, Binance Smart Chain (BSC) showcases a positive net inflow of 548.53k USD, indicating growing interest and investment.
Despite a negative net inflow of -64.35k USD, Solana exhibits a competitive token price of 92.6 USD and a notable market cap of 40.09 billion USD, signaling sustained user interest and adoption.
Polygon, Optimism, and Avalanche demonstrate varying levels of user interest. Polygon’s substantial negative net inflow of -5.95 million USD contrasts with a lower token price of 0.8 USD and a market cap of 7.04 billion USD. Optimism, with a positive net inflow of 59.82k USD, boasts a higher token price of 3.2 USD and a market cap of 3.064 billion USD. With a slightly negative net inflow of -0.25 million USD, Avalanche showcases a mid-range token price of 32.6 USD and a market cap of 11.969 billion USD.
In This News
Coins

$ 1.80K
+0.03%
$ 0.330
+0.05%
$ 572.06
-0.77%
$ 0.00...361

$ 0.0145


Predictions Markets
See what traders are focused on
Share:
In This News
Coins
$ 1.80K
+0.03%$ 0.330
+0.05%$ 572.06
-0.77%$ 0.00...361
$ 0.0145
Predictions Markets
See what traders are focused on
Share:
Read More

Insider-Linked Wallet Moves Another $9.15M in LAB Tokens to Aster, Raising Market Concerns