Ethereum (ETH) Faces Heavy Selling Pressure: Is $1,500 the Next Stop?

Share:
Predictions Markets
See what traders are focused on

- Ethereum (ETH) fell to a weekly low of $1,834, marking a 7% decline and approaching its yearly low of $1,760.
- ETH formed a bearish flag pattern, with MACD and PPO indicating weak momentum and high selling pressure.
After an eventful week, the crypto market is experiencing high volatility today, with Bitcoin (BTC) dropping to $82K once again during Asian trading hours. Ethereum (ETH) is also facing significant price swings, falling below $2K and hitting a weekly low of $1,834—a 7% drop. This brings it dangerously close to its yearly low of $1,760, recorded on March 11.
One major factor behind ETH’s decline is the latest inflation data from the US. The Core Personal Consumption Expenditure (PCE) Index rose from 2.7% in January to 2.8% in February while the headline PCE increased to 2.5%, exceeding the Federal Reserve’s 2% target. This suggests that inflation is still a concern, which could keep interest rates higher for longer. Additionally the impact of upcoming tariffs by Donald Trump may further influence market conditions.
In the past 24 hours, Ethereum has dropped 4%, falling from an intraday high of $1,911 to a low of $1,834. At the time of writing, ETH is trading at $1,849 with a market cap of $223.15 billion. Despite the price dip, Ethereum spot funds saw an inflow of $4.68 million after 17 consecutive days of outflows since March 5, as per SoSoValue data.

Will Ethereum (ETH) Continue to Decline or Gain Momentum Above $2K?
From a technical perspective, Ethereum’s chart shows a bearish trend. It had formed a triple-top pattern in the weekly chart with resistance at $4,000 and key support at $1,760. The ETH price dropped below this support level earlier this month and recently retested that confirming a bearish continuation. The formation of a bearish flag pattern signals potential further downside.
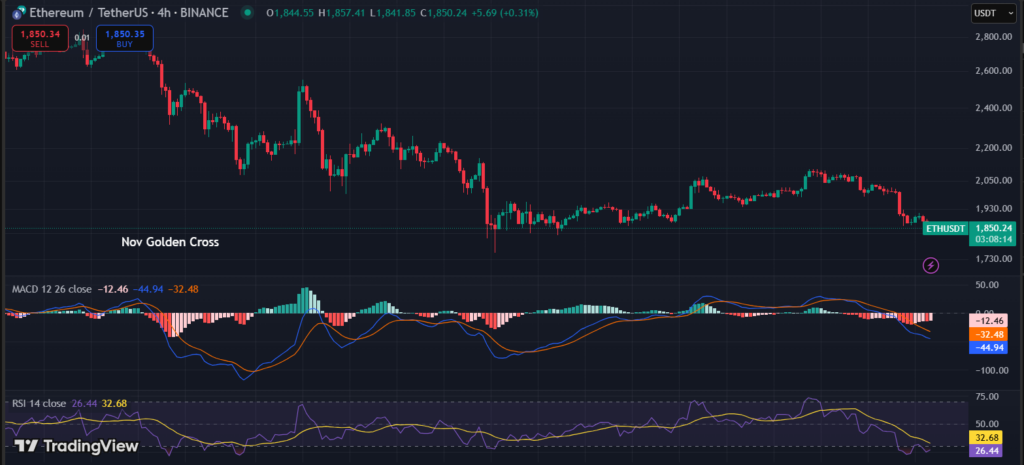
On the 4-hour ETH/USDT chart both the MACD and PPO indicators are below the signal line that confirms the bearish trend for Ethereum. Zooming in, the Relative Strength Index (RSI) sits at 26.71 that indicating Ethereum is in oversold territory. This suggests weak momentum, increased selling pressure, and further price declines.
Looking ahead, if Ethereum failed to hold above $1,800 and drop below $1,750 ETH could decline further to $1,550, a key support level last seen in October 2023. However, if buyers manage to push the price above $2,120, it could invalidate the bearish outlook and spark a recovery.
In This News
Coins

$ 64.29K
+0.70%
$ 1.83K
+2.17%
$ 0.99922
0%
$ 0.00...361

$ 0.000207


Predictions Markets
See what traders are focused on
Share:
In This News
Coins
$ 64.29K
+0.70%$ 1.83K
+2.17%$ 0.99922
0%$ 0.00...361
$ 0.000207
Predictions Markets
See what traders are focused on
Share:
Read More
Bitcoin, XRP, DOGE Rise as US-Iran Technical Talks to Continue Despite Strikes