Solana Holds $100 Support After 45% Monthly Gains—Can SOL Price Reach $110 in September?

Share:
Solana has rebounded in crypto markets from its June low near $60.66 to reclaim above $100 and is now testing a key resistance near $115 after trading around the 0.5 FIB level at $104.50. Institutional demand, strong network activity and upcoming upgrades support adoption and a bullish token backdrop, but MACD shows waning buying pressure and a potential bearish crossover while the 50- and 200-day moving averages approach a possible golden cross that could absorb selling volume.
Predictions Markets
See what traders are focused on

Solana’s price is showing signs of a potential trend reversal after recovering sharply from its June lows, near $60.66. It has climbed back above $100 and is now testing a crucial resistance, with the next major target close to $115. The recent breakout has also pushed the momentum higher, but the rally now faces a key test: can the SOL price hold above $100 and break through the $115 resistance zone?
Besides, the institutional demand, strong network activity and upcoming Solana upgrades add to the prevailing bullish backdrop. The next few sessions could determine whether this is the beginning of a recovery or another rejection incoming.
Solana Price Reclaims $100, But $115 is the Real Test
Solana’s price is displaying a significant shift in its structure, but the rally is now approaching a critical resistance. After rebounding sharply from the June low close to $60, the price has climbed above its key MA levels. Currently, the price is chopping around a pivotal resistance zone, while the MACD is signaling caution.
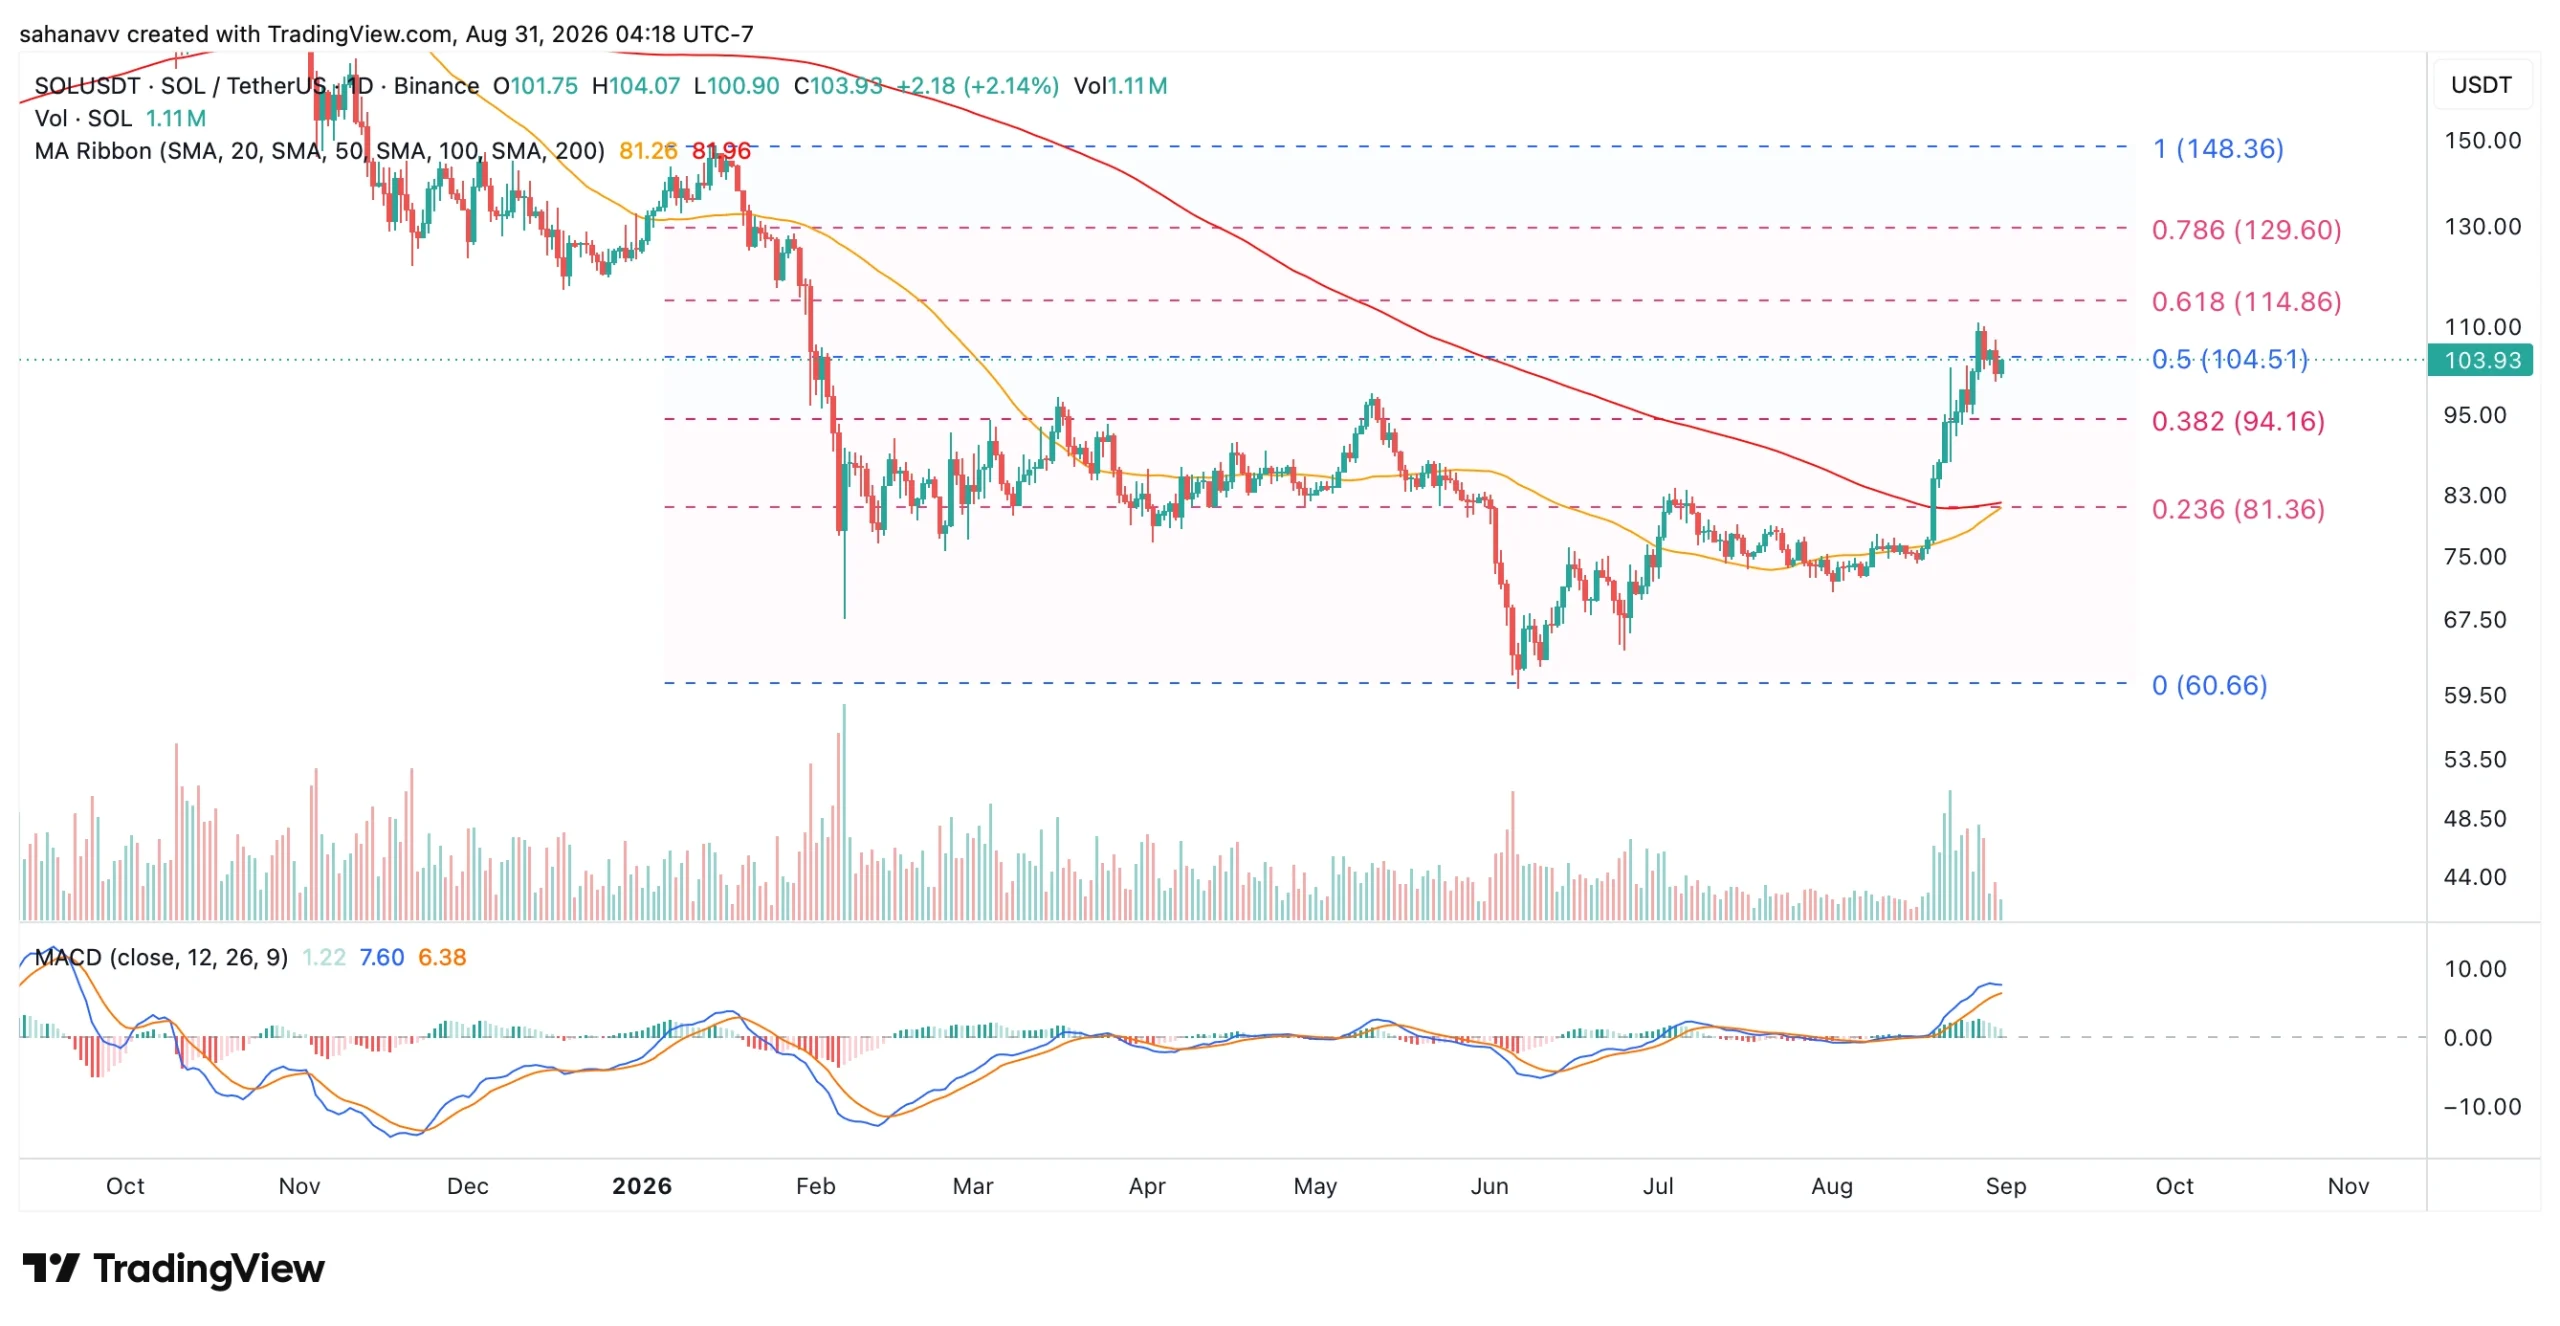
The MACD shows a drop in the buying pressure, with bullish momentum losing strength and a potential bearish crossover developing. Interestingly, this comes as the 50-day and 200-day MA move toward a potential golden cross. This creates a divergence: MACD points to the rally losing momentum, while the MAs suggest the underlying trend may turn bullish. Therefore, even if MACD undergoes a bearish crossover, if price continues to hold $100, the ‘golden cross’ may absorb selling volume, paving the way for an extended ascending trend.
Meanwhile, the price, which is sitting around the 0.5 FIB level at $104.50, may face another rejection to $100 or below. For now, SOL’s price action suggests that the key question is not whether momentum has slowed, but whether buyers can absorb the selling pressure without surrendering the recent breakout.
In This News
Coins

$ 102.54
-3.90%1654073624197.png)
$ 102.93
-3.93%Predictions Markets
See what traders are focused on
Share:
In This News
Coins
$ 102.54
-3.90%$ 102.93
-3.93%Predictions Markets
See what traders are focused on
Share:
Read More

Uniswap Price Jumps 122% as Binance Whales Keep Buying: $7.80 Target Next?