Bitcoin Leveraged Positions Building Up: BTC To $50,000 Or $60,000?

Share:
Predictions Markets
See what traders are focused on

Bitcoin is firm at spot rates, looking at the development in the daily chart. Even so, the downtrend remains, and price action remains within a bearish breakout formation. This outlook follows the dump on September 7 that saw the world’s most valuable coin plunge, approaching the all-important round number, $50,000.
Bitcoin Leveraged Positions Building Up
Technically, the downtrend remains, especially if bulls can’t unwind the losses of September 7. From an effort-versus-result perspective, the trend set in motion by September 7 will shape the short-term, possibly accelerating the fall below August lows.
Amid this development, one on-chain analyst notes that there has been a massive accumulation of leveraged positions from March 2024. Though it remains uncertain which direction prices will move, the current state of affairs means sellers have the upper hand.
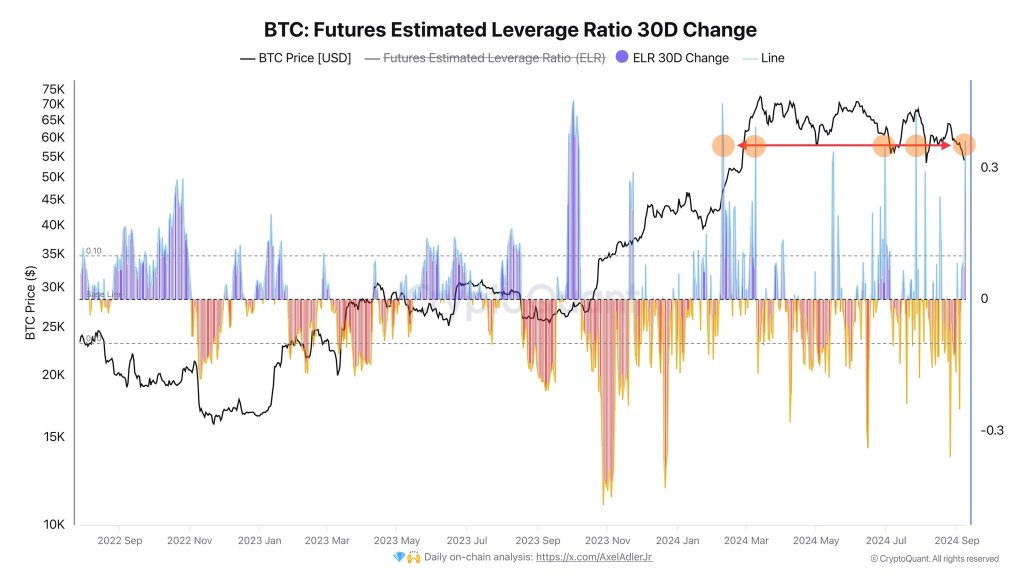
If bulls take over, this would be a massive sentiment boost for BTC bulls, who have had to contend with sharp losses over the past three months. Regardless of the direction, this build-up in leverage position precedes a period of heightened volatility in the coming days.
While Bitcoin trends lower, sentiment has taken a hit, explaining the shrinking trading volume over the past two weeks. Since late August, BTC has fallen from around $66,000, losing nearly 20% by last week’s lows.
At the same time, volatility is comparatively low and not unlike the state of affairs when BTC turned the corner, sharply expanding from late February before printing fresh all-time highs in mid-March 2024.
Average Funding Rate Is Bullish, Will This Change?
Interestingly, despite the lower lows, trading data shows that the average funding rate across derivatives exchanges has remained bullish for over a year.
This development could be due to the shift in price action that saw the world’s most valuable coin turn the corner, rising from late Q3 2023. The recovery saw BTC shake off weakness and explode to above $70,000 after losses in 2022 that took the coin to as low as $15,800.
For bulls to dominate in the derivatives market, prices must recover steadily. A break above $66,000 and July highs would likely spur demand, lifting the coin above the multi-month resistance at $72,000.
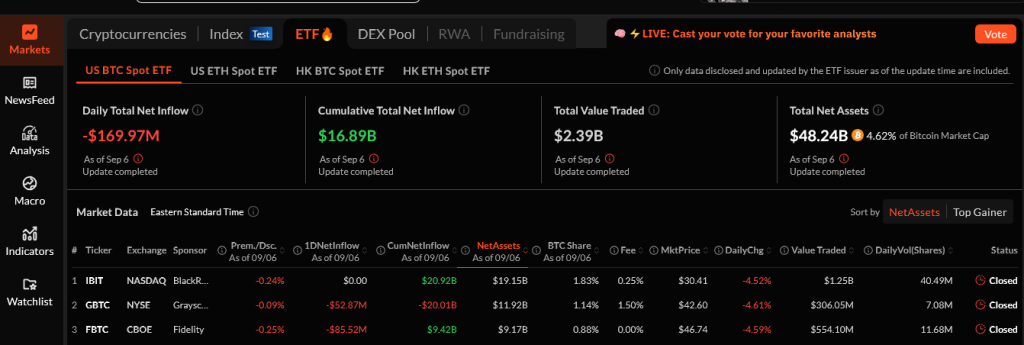
Nonetheless, for this to happen, there must be inflows to spot Bitcoin ETFs. Falling prices have accelerated outflows from this product, meaning institutions are playing safe. So far, SosoValue shows outflows of over $169 million for spot Bitcoin ETF issuers in the United States.
In This News
Coins

$ 64.22K
+0.41%
$ 0.00732
+2.77%
$ 0.00...361

$ 0.000603

$ 0.000369


Predictions Markets
See what traders are focused on
Share:
In This News
Coins
$ 64.22K
+0.41%$ 0.00732
+2.77%$ 0.00...361
$ 0.000603
$ 0.000369
Predictions Markets
See what traders are focused on
Share:
Read More

Bitcoin (BTC) Enters a Critical Zone: Will Buyers Fuel a Breakout or Surrender $60K?