Dogecoin Price Prediction August 2026: Is the Third Test of DOGE’s Demand Zone a Base or a Breakdown?

Share:
Dogecoin trades at $0.06961 on July 31, down 1.30% and 43% from its May high, retesting a demand zone for the third time with every EMA acting as resistance and the lower Bollinger Band at $0.06881 as a potential floor. Rare multi-timeframe TD Sequential buy signals fired simultaneously on monthly, weekly, 3-day and daily charts, but weak seasonality with August median returns of −5.17% over 13 years points to a mixed short-term technical outlook for the token and crypto traders.
Predictions Markets
See what traders are focused on

- TD Sequential buy signals fired simultaneously on DOGE’s monthly, weekly, 3-day, and daily charts, a rare multi-timeframe alignment per Ali Charts
- DOGE is down 43% from its May high and retesting the same demand zone for the third time, with the lower Bollinger Band at $0.06881 as the floor
- August has a -5.17% median return for DOGE across thirteen years, the second worst seasonal month in its calendar
Dogecoin trades at $0.06961 on July 31, down 1.30%, retesting a demand zone that has held since the June lows as TD Sequential buy signals fire simultaneously across four timeframes for the first time in recent memory.
DOGE Is Retesting The Demand Zone With Every EMA Above As Resistance
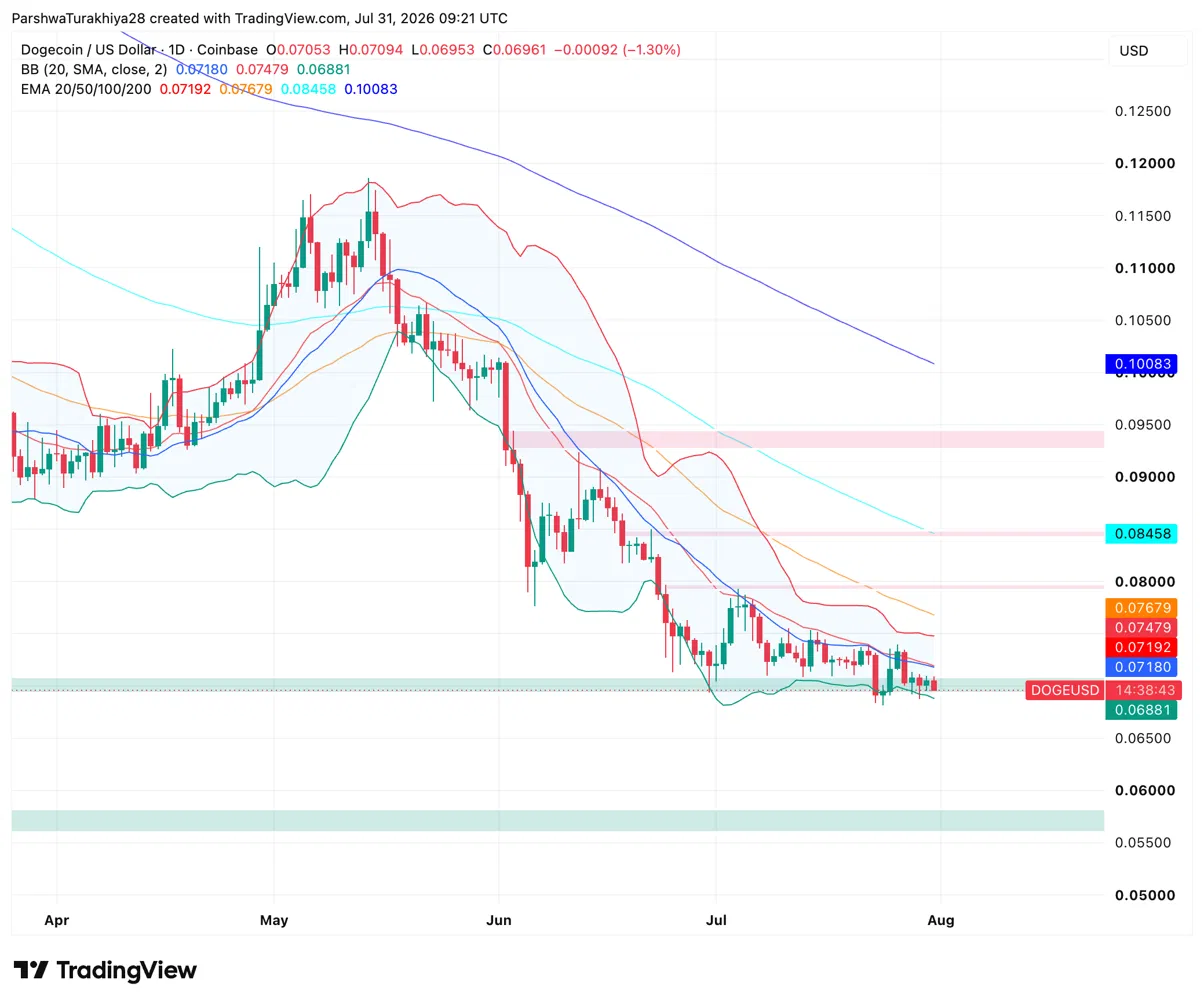
DOGE is pressing against the lower Bollinger Band at $0.06881, inside a demand zone that has held through two prior tests since the Ju…
Read The Full Article Dogecoin Price Prediction August 2026: Is the Third Test of DOGE’s Demand Zone a Base or a Breakdown? On Coin Edition.


Read More

Momentum Price Prediction: MMT Gains 64% Weekly as Open Interest Hits Record High