
Ethereum Signals Bullish Reversal via Key MVRV Metric

Share:
Ethereum's daily MVRV has crossed above its 160-day SMA (a Golden Cross), signaling a potential end to capitulation and a bullish reversal; previous Golden Crosses preceded ETH rallies of 50%, 166%, 74% and 113%. Institutional and whale demand is backing the move with three straight weeks of spot ETH ETF inflows (week: $103.9M; July total: $337.74M), Bitmine buying over 9,900 ETH, mid-tier whale wallets rising from 4,750 to 4,850, mega-whales holding 17.41M ETH (~22% of supply), staking rising from 63 billion to 77 billion, ETH/BTC strength and ETH trading at $1,939 after wiping >$100M in short liquidations. Bulls need to defend the $1,850–$1,900 demand zone and reclaim the 200-day MA at $2,134 to target $2,300, while near-term risks include the Fed rate decision, the CLARITY Act vote on August 3 and Middle East geopolitical tensions, making this development broadly bullish for crypto adoption, ETFs, staking and price momentum.
Predictions Markets
See what traders are focused on

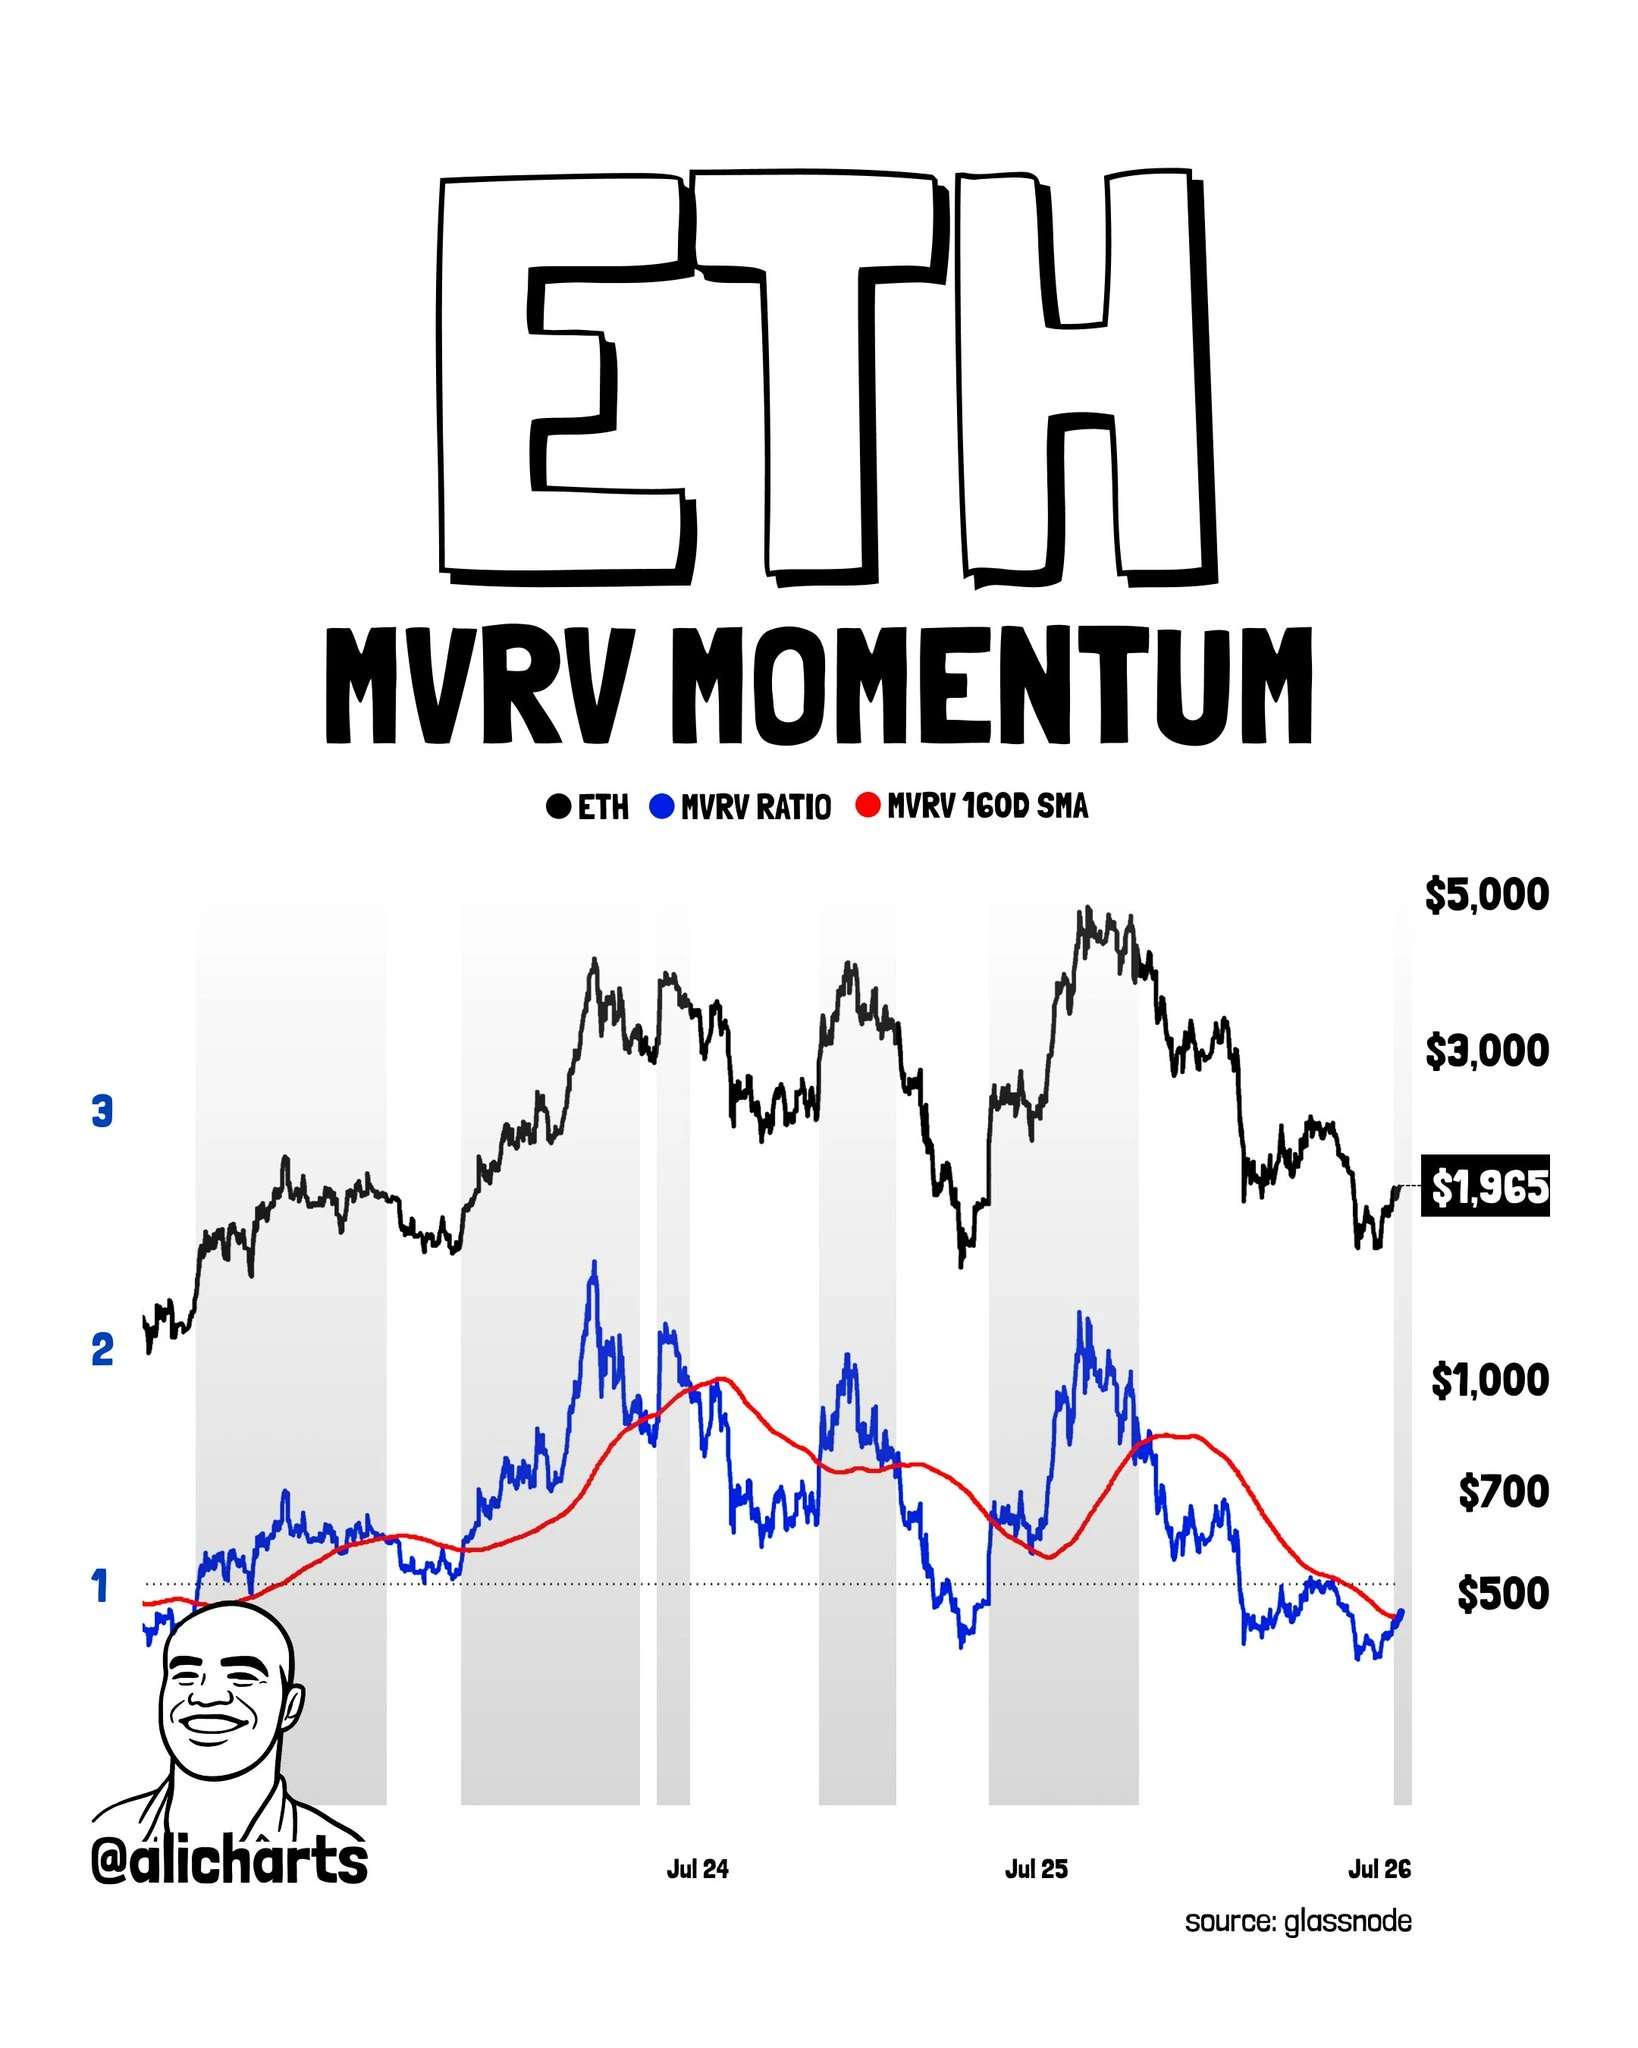
The daily Market Value to Realized Value (MVRV) ratio of Ethereum (ETH) has decisively crossed above its 160-day Simple Moving Average. Known as a Golden Cross, the move signals the end of ETH’s capitulation phase, and the beginning of a bullish reversal.
Source: X
Ethereum Golden Cross and bullish supporters
In the past three years, a Golden Cross preceded major ETH recoveries as the accumulation regime overpowered distribution. This was seen in early 2023, late 2023-Q1 2024, Q2 2024 and Q3 2024 where the price of ETH surged by 50%, 166%, 74% and 113% respectively.
Data also reveals renewed institutional engagements, with the past week marking the third consecutive week of spot Ethereum ETFs inflows. That week brought in $103.9 million, bringing July’s total net inflows to $337.74 million.
In the same week, Bitmine, the largest public Ethereum treasury firm, purchased over 9,900 ETH. This contributed to the coin’s 27% hike in the past month.
Even more, whales have been aggressively accumulating the digital asset since June. Wallets of mid-tier whales (holding 1,000 – 10,000 ETH) increased from 4,750 in June to 4,850 by late July. Wallets of mega-whales (holding over 100,000 ETH) collectively hold 17.41 million ETH (over 22% of the total circulating supply).
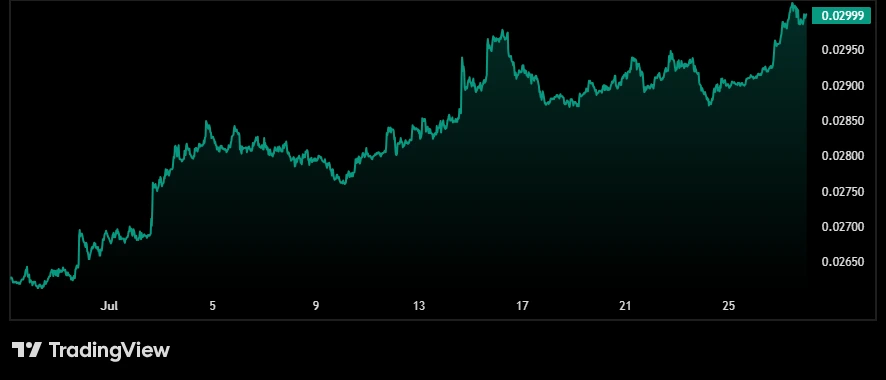
Ethereum buy demand has also been outpacing that of Bitcoin in the past month as shown by the rising ETH/BTC ratio below.
Source: Trading View
Additionally, the amount of ETH staked has risen from 63 billion in July 1, to a present 77 billion, indicating positive sentiment in the network.
Key price support and resistance zones
ETH is up 0.85% in the past 24h, wiping out over $100 million in short liquidations and bringing its current price to $1,939.
To maintain the Golden Cross, bulls need to defend the $1,850 – $1,900 demand zone. Further reclamation of prices above the 200-day MA ($2,134) is necessary to confirm a true macro trend reversal. This would also open the way to the $2,300 resistance zone.
Key events that could impact the near-term price of Ethereum include upcoming Fed rates announcement. Others are the tentative Senate floor vote on the CLARITY Act on August 3 and the Middle East conflict.


