
How to Read Crypto Charts in 2026: Beginners Guide
Share:
The guide argues most crypto losses come from traders ignoring charts rather than picking the wrong coin, noting Bitcoin topped about $126,000 in October 2025 then plunged over 55% by mid-2026, wiping out buyers without chart context. It stresses learning candlestick charts, pattern recognition and basic technical signals to reduce emotional trading risk and improve decision-making in crypto trading and DeFi markets.
Predictions Markets
See what traders are focused on

Most people who lose money in crypto do not lose it because they picked the wrong coin. They lost it because they had no idea what the chart was telling them before they bought it.
Bitcoin reached an all-time high of around $126,000 in October 2025, then shed more than 55% by mid-2026, a brutal correction that wiped out traders who bought without any chart context.
Learning to read a crypto chart is not about becoming a Wall Street analyst. It is about developing enough pattern recognition to make informed decisions instead of emotional ones.
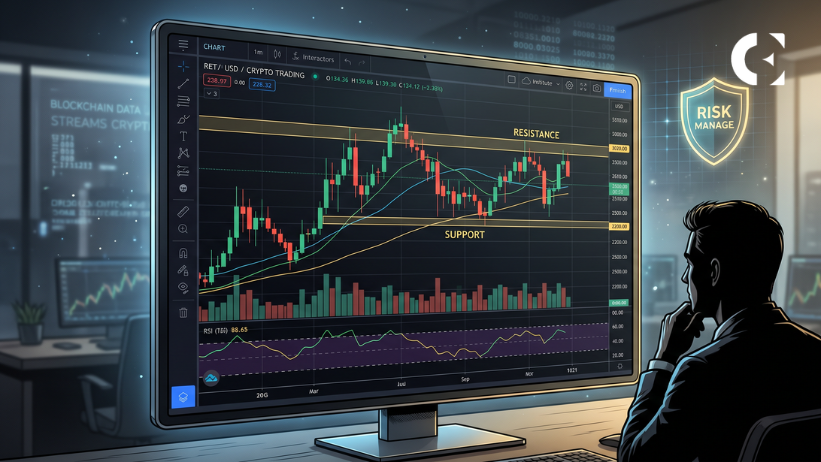
1. Understanding Candlestick Charts
The most common chart type in crypto is the candlestick chart. Each candle represents price movement over a chosen period of time and shows four data points: the open price, the close price, the high, and the low.
A green (or white) candle means the price closed higher than it opened �…
Read The Full Article How to Read Crypto Charts in 2026: Beginners Guide On Coin Edition.
In This News
Coins

$ 63.98K
+1.20%Predictions Markets
See what traders are focused on
Share:
In This News
Coins
$ 63.98K
+1.20%Predictions Markets
See what traders are focused on
Share: