BTC/USDT Spot CVD Chart Analysis: July 29 Volume Heatmap and Order Flow Insights
Share:
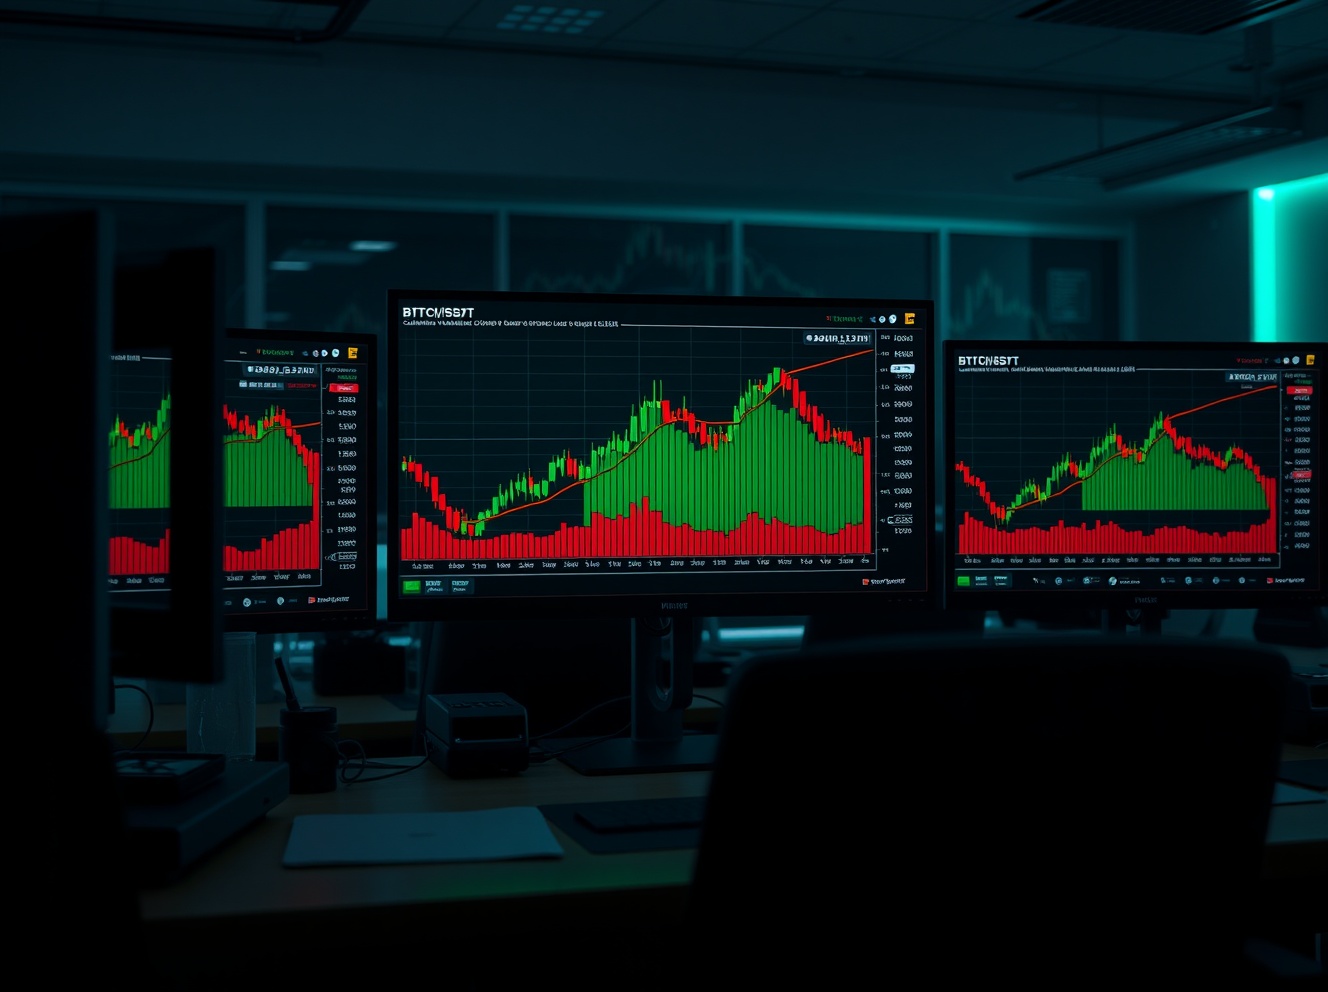
On July 29 the BTC/USDT spot CVD chart and volume heatmap showed concentrated trading at key price levels with the yellow CVD line for $100–$1,000 orders (retail) behaving erratically while the brown line for $1M–$10M orders (institutional) climbed. Large orders were accumulating near a key resistance, indicating possible institutional accumulation but also potential selling pressure and heightened volatility; traders can use CVD and volume heatmap levels to contextualize order flow in crypto markets.
Predictions Markets
See what traders are focused on

BitcoinWorld
BTC/USDT Spot CVD Chart Analysis: July 29 Volume Heatmap and Order Flow Insights
On July 29, the BTC/USDT spot cumulative volume delta (CVD) chart provided traders with a detailed view of order book dynamics, highlighting key price levels where buying and selling pressure concentrated. The chart, which analyzes the BTC/USDT spot trading pair, combines a volume heatmap in the upper section with a CVD indicator below, offering insights into potential support and resistance zones.
Understanding the Volume Heatmap
The upper section of the chart displays a volume heatmap that tracks trading activity at each price level. The background color intensifies when the price lingers in a specific range for an extended period or undergoes a significant move. Areas approaching brighter colors often indicate regions where the market has previously shown strong interest, potentially acting as support or resistance in future trading sessions. For traders, these zones can signal where to expect price reactions.
Cumulative Volume Delta and Order Flow
The lower section of the chart features the cumulative volume delta (CVD) indicator, which reflects the net difference between buy and sell orders, segmented by order size. As buy orders increase, the corresponding line rises. The yellow line represents orders ranging from $100 to $1,000, while the brown line tracks large orders between $1 million and $10 million. This differentiation helps traders gauge the participation of retail versus institutional or large-scale participants. On July 29, the CVD data showed notable divergence between these order sizes, suggesting varying levels of conviction among market participants.
Implications for Traders
Analyzing the spot CVD chart on a daily basis allows traders to identify shifts in market sentiment that may not be immediately visible on price charts alone. The volume heatmap’s bright zones can serve as reference points for setting stop-losses or take-profit levels, while CVD trends help confirm whether price movements are supported by genuine order flow. For the BTC/USDT pair, the July 29 data indicated that large orders were accumulating near a key resistance level, while smaller orders showed more erratic behavior, pointing to potential volatility ahead.
Conclusion
The July 29 spot CVD chart for BTC/USDT offers a granular look at market structure, combining volume concentration and order flow analysis. Traders using these tools can better anticipate price reactions at key levels and align their strategies with the underlying market dynamics. As always, combining CVD and volume heatmap data with other technical indicators can improve decision-making in the volatile cryptocurrency market.
FAQs
Q1: What does the volume heatmap indicate on a BTC/USDT spot CVD chart?
The volume heatmap shows trading volume at each price level, with brighter colors indicating areas where the price has spent more time or made significant moves. These zones often act as support or resistance.
Q2: How does the cumulative volume delta (CVD) differ from regular volume indicators?
CVD tracks the net difference between buy and sell orders, segmented by order size, providing insight into whether price movements are driven by aggressive buying or selling. It offers a more detailed view of order flow than simple volume bars.
Q3: What do the yellow and brown lines represent in the CVD chart?
The yellow line tracks orders between $100 and $1,000, typically associated with retail traders. The brown line tracks large orders from $1 million to $10 million, often linked to institutional or high-net-worth participants. Their divergence can signal shifts in market sentiment.
This post BTC/USDT Spot CVD Chart Analysis: July 29 Volume Heatmap and Order Flow Insights first appeared on BitcoinWorld.


Read More

Spot CVD Chart Analysis for BTC/USDT: Volume Heatmap and Order Flow Insights at July 28