OFFICIAL TRUMP (TRUMP) Slides to $3: Hold the Line or Head for Deeper Losses?

Share:
OFFICIAL TRUMP (TRUMP) is trading at approximately $3.51, experiencing a 5.65% decline in the last 24 hours with a trading volume of $154M. Key indicators show mixed signals, with a potential test of resistance at $3.62 and support near $3.42 amid bearish market sentiments. Overall market trends are uncertain, heavily influenced by Bitcoin and Ethereum prices.
Predictions Markets
See what traders are focused on

- OFFICIAL TRUMP is trading around the $3 mark.
- TRUMP’s daily trading volume has reached $154M.
Within the severe downside anxiety, most of the crypto tokens are facing mixed signals. This uncertain sentiment is reflected in their price action. The largest asset, Bitcoin (BTC), hovers around $68.1K, and the largest altcoin, Ethereum (ETH), trades at $1.9K. Among the altcoins, OFFICIAL TRUMP (TRUMP) has moved down with a 5.65% drop in the last 24 hours.
The asset opened the day trading at a high range of $3.78, and upon the bearish encounter, the TRUMP price retraced to a bottom level of $3.47. At the time of writing, OFFICIAL TRUMP is trading at $3.51, with its daily trading volume spiking and reaching $154.13 million. As per Coinglass data, the TRUMP market has witnessed a liquidation of $495.27K.
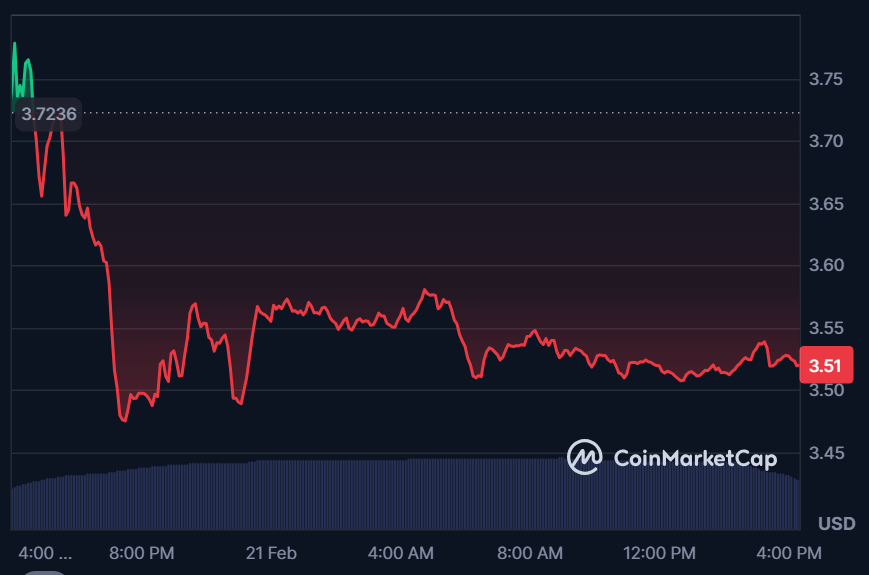
As the trading chart shows the bullish pressure, the OFFICIAL TRUMP price could jump above the $3.62 resistance level. If a resurgence in demand happens, the golden cross might emerge and push the token above $3.73. If the asset’s chart turns red, OFFICIAL TRUMP might fall back to its support range at around $3.42. Further losses could trigger the bears to gain more power, likely initiating the death cross to form, and sending the price below $3.31
Bullish Indicators Align — How High Can OFFICIAL TRUMP Climb?
With the Moving Average Convergence Divergence (MACD) line briefly crossing above the signal line, and both remaining above the zero line, it hints at a broader bullish trend. The current momentum of OFFICIAL TRUMP is attempting to strengthen further.
In addition, the Chaikin Money Flow (CMF) indicator is resting at 0.09 points toward the buying pressure in the TRUMP market, which is not strong. This positive value shows that the capital inflow is outweighing the outflow, giving an early sign of the accumulation phase.
OFFICIAL TRUMP’s Relative Strength Index (RSI) at 52.97 signals a slight bullish market sentiment. The buyers have a small advantage and remain in a balanced zone. The value is far below 70, with enough potential to rise and hit the overbought floor.
Furthermore, the Bull Bear Power (BBP) reading at -0.003 implies almost a neutral momentum for TRUMP, with a slight bearish tilt. Notably, as the value is just below the zero mark, the sellers hold a very minor edge, but the ongoing pressure is weak.
Top Updated Crypto News
Cardano (ADA) Faces a Key Test: Sustainable Breakout or Classic Bull Trap?


Read More

5 Altcoins Stand to Gain From Tokenized Stocks, Grayscale Says