Bitcoin pulls back after $76K test as ETF flows turn volatile

Share:
Bitcoin retraced from a $76,000 test to trade around $74,432; technicals show a mild bullish bias (4H RSI 60, expanding MACD) with key supports at the 50‑day EMA $71,021 and $68,950 (23.6% fib), and resistances at $76,132, $78,962 and $80,000. Institutional demand underpins the move: US spot Bitcoin ETFs recorded a $411.41M inflow on Tuesday, bringing total net ETF inflows to $57.28B and AUM to $94.09B, though flows remain volatile (Monday outflow $291.11M). Market impact: ETF-driven crypto adoption and funding are bullish for BTC price upside if inflows continue, but volatile flows and failed resistance tests present short-term risk to the rally; relevant keywords: crypto, Bitcoin, ETF, institutional, adoption, trading.
Predictions Markets
See what traders are focused on

The cryptocurrency market has slightly retraced following its rally earlier this week. Bitcoin raced to the $76,000 level on Tuesday but failed to take out the resistance level and has now retraced.
At press time, Bitcoin is trading above $74,400. It could either retest the $76,132 resistance level again, or it could drop towards the $70,000 support region.
Institutional appetite for Bitcoin rises
Bitcoin’s surge earlier this week is mostly supported by growing institutional demand.
According to CoinGlass, the US spot Bitcoin Exchange Traded Funds (ETFs) recorded an inflow of $411.41 million on Tuesday, bringing their total net inflow to $57.28 billion.
Bitcoin spot Exchange Traded Funds (ETFs) recorded an outflow of $291.11 million on Monday, after inflows of $786.31 million the previous week.
Thanks to this latest inflow, the Bitcoin ETFs now have a total net asset of $94.09 billion.
If these outflows continue or intensify, it would cap Bitcoin’s ongoing price rally; however, if inflows occur, it would reinforce bullish momentum and potentially support further upside in BTC.
BTC’s positive performance this week was also due to positive geopolitical developments.
On Monday, Donald Trump stated during a press conference that Iran is eager to strike a deal “very badly,” even as he confirmed that the US Navy has initiated a blockade of Iranian ports following the collapse of recent peace talks.
Yesterday, Reuters reported that negotiating teams from the US and Iran could return to Islamabad this week.
This latest development comes after the two parties failed to get a breakthrough in the first round of talks.
Bitcoin price forecast
The BTC/USD 4-hour chart remains bearish and efficient despite the recent rally.
Bitcoin is currently trading at $74,432, above the 50-day Exponential Moving Average (EMA) at $71,021.
The momentum indicators show a mild bullish bias in the near term.
The Relative Strength Index (RSI) on the 4-hour chart reads 60, above the neutral level but not yet within the overbought region.
The Moving Average Convergence Divergence (MACD) histogram is also expanding, suggesting that the upside momentum remains constructive.
If the rally persists, BTC could retest the 4-hour swing high of $76,132 once again. Bitcoin took out the 100-day EMA at $75,300 on Tuesday, and this level might not present another challenge.
However, it could encounter further resistance at the 50% retracements at $78,962 and the psychological $80,000 level.
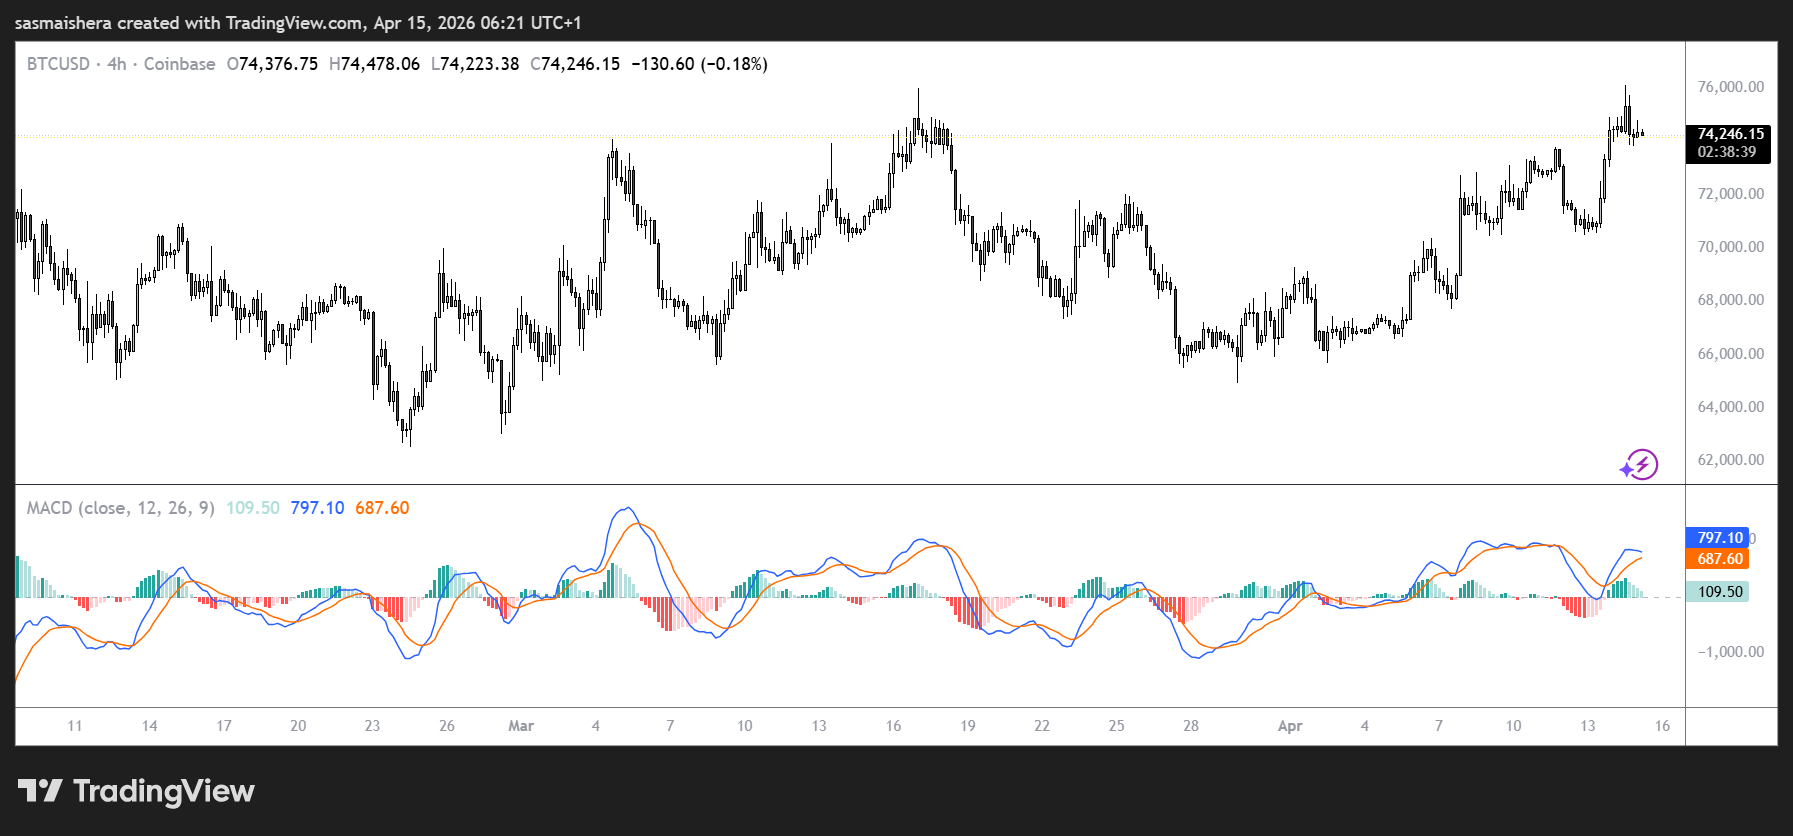
A daily candle close above these levels could expose the 200-day EMA at $83,245, the 61.8% Fibonacci retracements at $83,437, and a higher horizontal cap near $84,410 define a broader supply zone.
However, if the sellers regain control, they would encounter immediate support around the 50-day EMA at 71,021.
Failure to defend this level would expose the 23.6% Fibonacci retracement at $68,950, with another support around the $67,412 region also a possibility.
The post Bitcoin pulls back after $76K test as ETF flows turn volatile appeared first on Invezz


Read More

Analysts say weekly death cross in Bitcoin signals late bear market phase, not immediate collapse