What’s Causing the Current Bitcoin Crash and How Low Can it Go? (BTC Price Analysis)
Share:
Predictions Markets
See what traders are focused on

Bitcoin’s price has been very bullish over the last couple of months. However, it is finally showing subtle signs of correction today.
Therefore, it is worth analyzing the charts for potential support levels.
Technical Analysis
By TradingRage
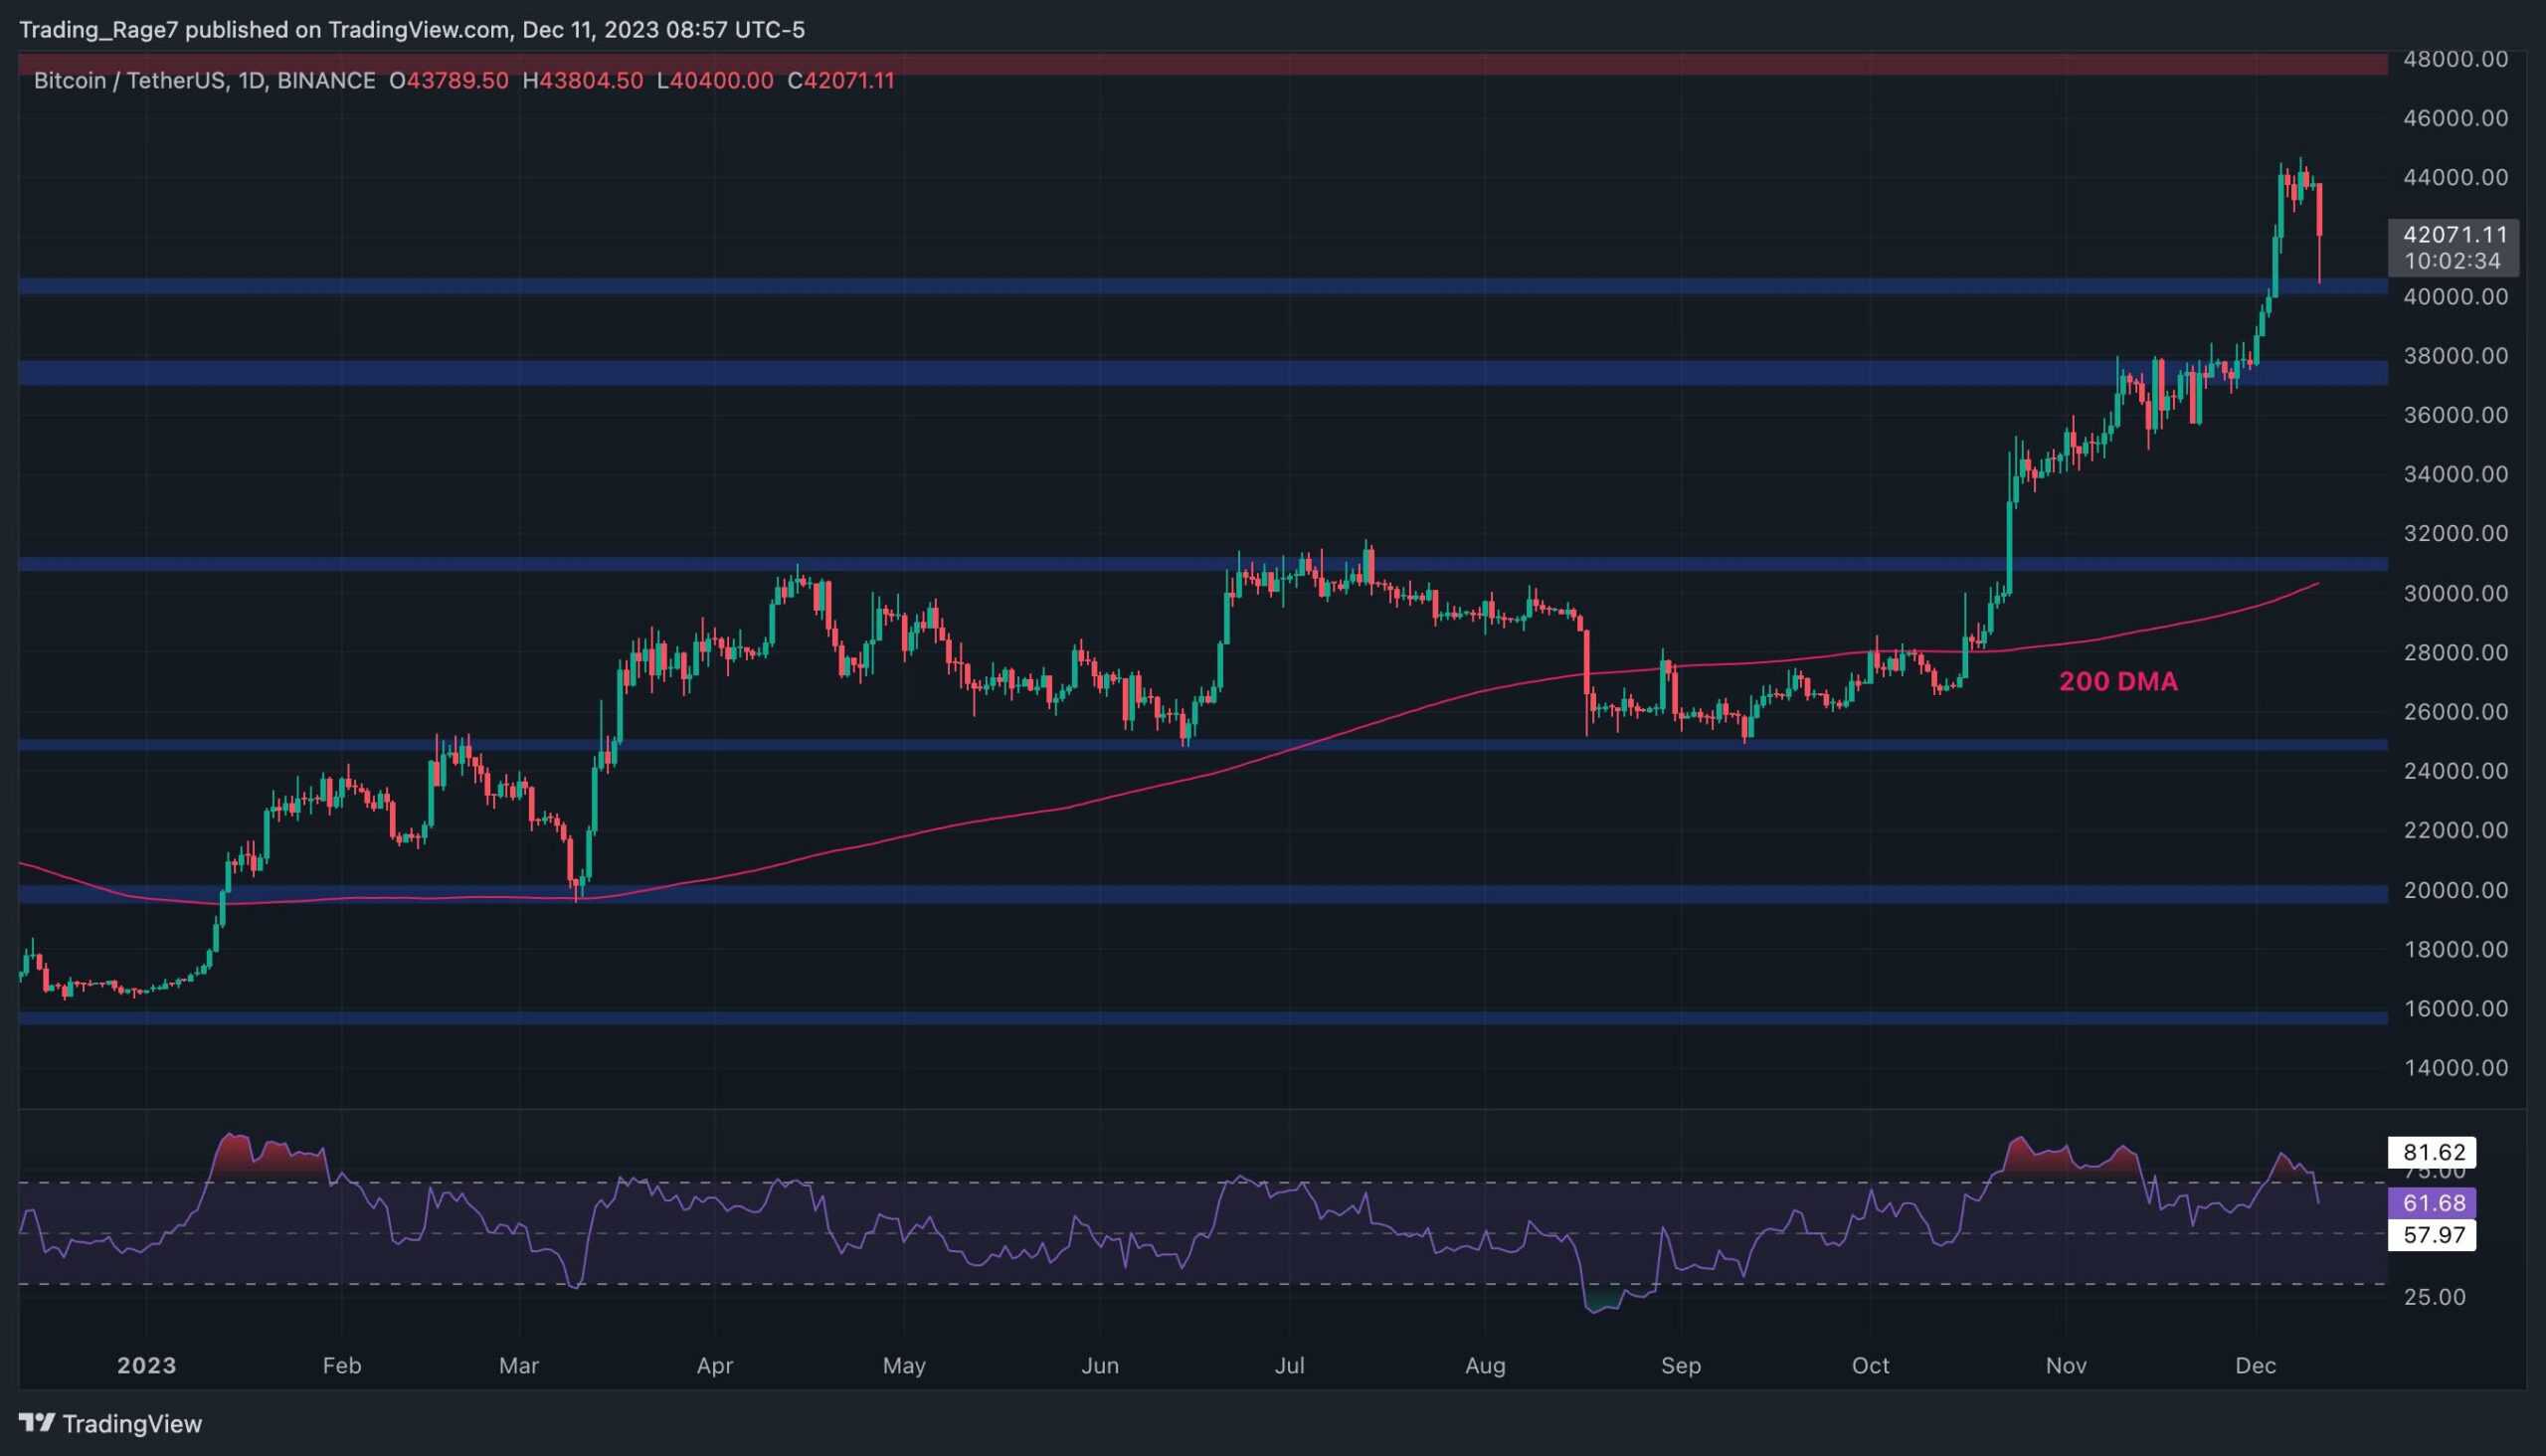
Bitcoin Price Analysis: The Daily Chart
On the daily chart, the price has been blowing past resistance levels one by one. Yet, today’s action has been very bearish, as the daily candle looks very bearish. The price has dropped around 10% today before rebounding from the $40K support level.
In case this level holds, it could initiate a rebound, and the market might rally toward the next significant resistance level, which is located at the $48K mark. On the other hand, a bearish breakout could result in a drop to the $38K and potentially the $31K zone.
BTC Price on The 4-Hour Chart
The 4-hour chart demonstrates today’s decline much more clearly. The price has created a double top pattern around the $44,500 mark and proceeded to plunge toward the $40K zone. Moreover, the relative strength index is trending downwards below the 50% line but is yet to reach the oversold territory.
As a result, another drop could be expected in the short term, and the market’s fate in the next few months would be decided by the price’s reaction to the $40K support level.

On-Chain Analysis
By Shayan
Bitcoin NUPL
Analyzing the overall sentiment of market participants is crucial for understanding trends. The behavior of major players, especially during the distribution and accumulation phases, often signals the beginning or end of bullish and bearish cycles.
The chart presented illustrates the Net Unrealized Profit/Loss (NUPL) metric, representing the overall profit/loss ratio across all coins. The metric has surged and entered the Orange section due to a substantial increase in Bitcoin’s price. Historically, when the NUPL metric enters the Orange region, it indicates a robust bull run, typically followed by fresh, solid, bullish rallies. Therefore, the market is anticipated to sustain its upward momentum in the long run.
The NUPL metric in the Orange region serves as a positive signal for market participants, suggesting favorable conditions for continued bullish trends. However, it’s essential to remain vigilant and monitor market dynamics for any potential shifts in sentiment that could impact future trends.

The post What’s Causing the Current Bitcoin Crash and How Low Can it Go? (BTC Price Analysis) appeared first on CryptoPotato.


Read More

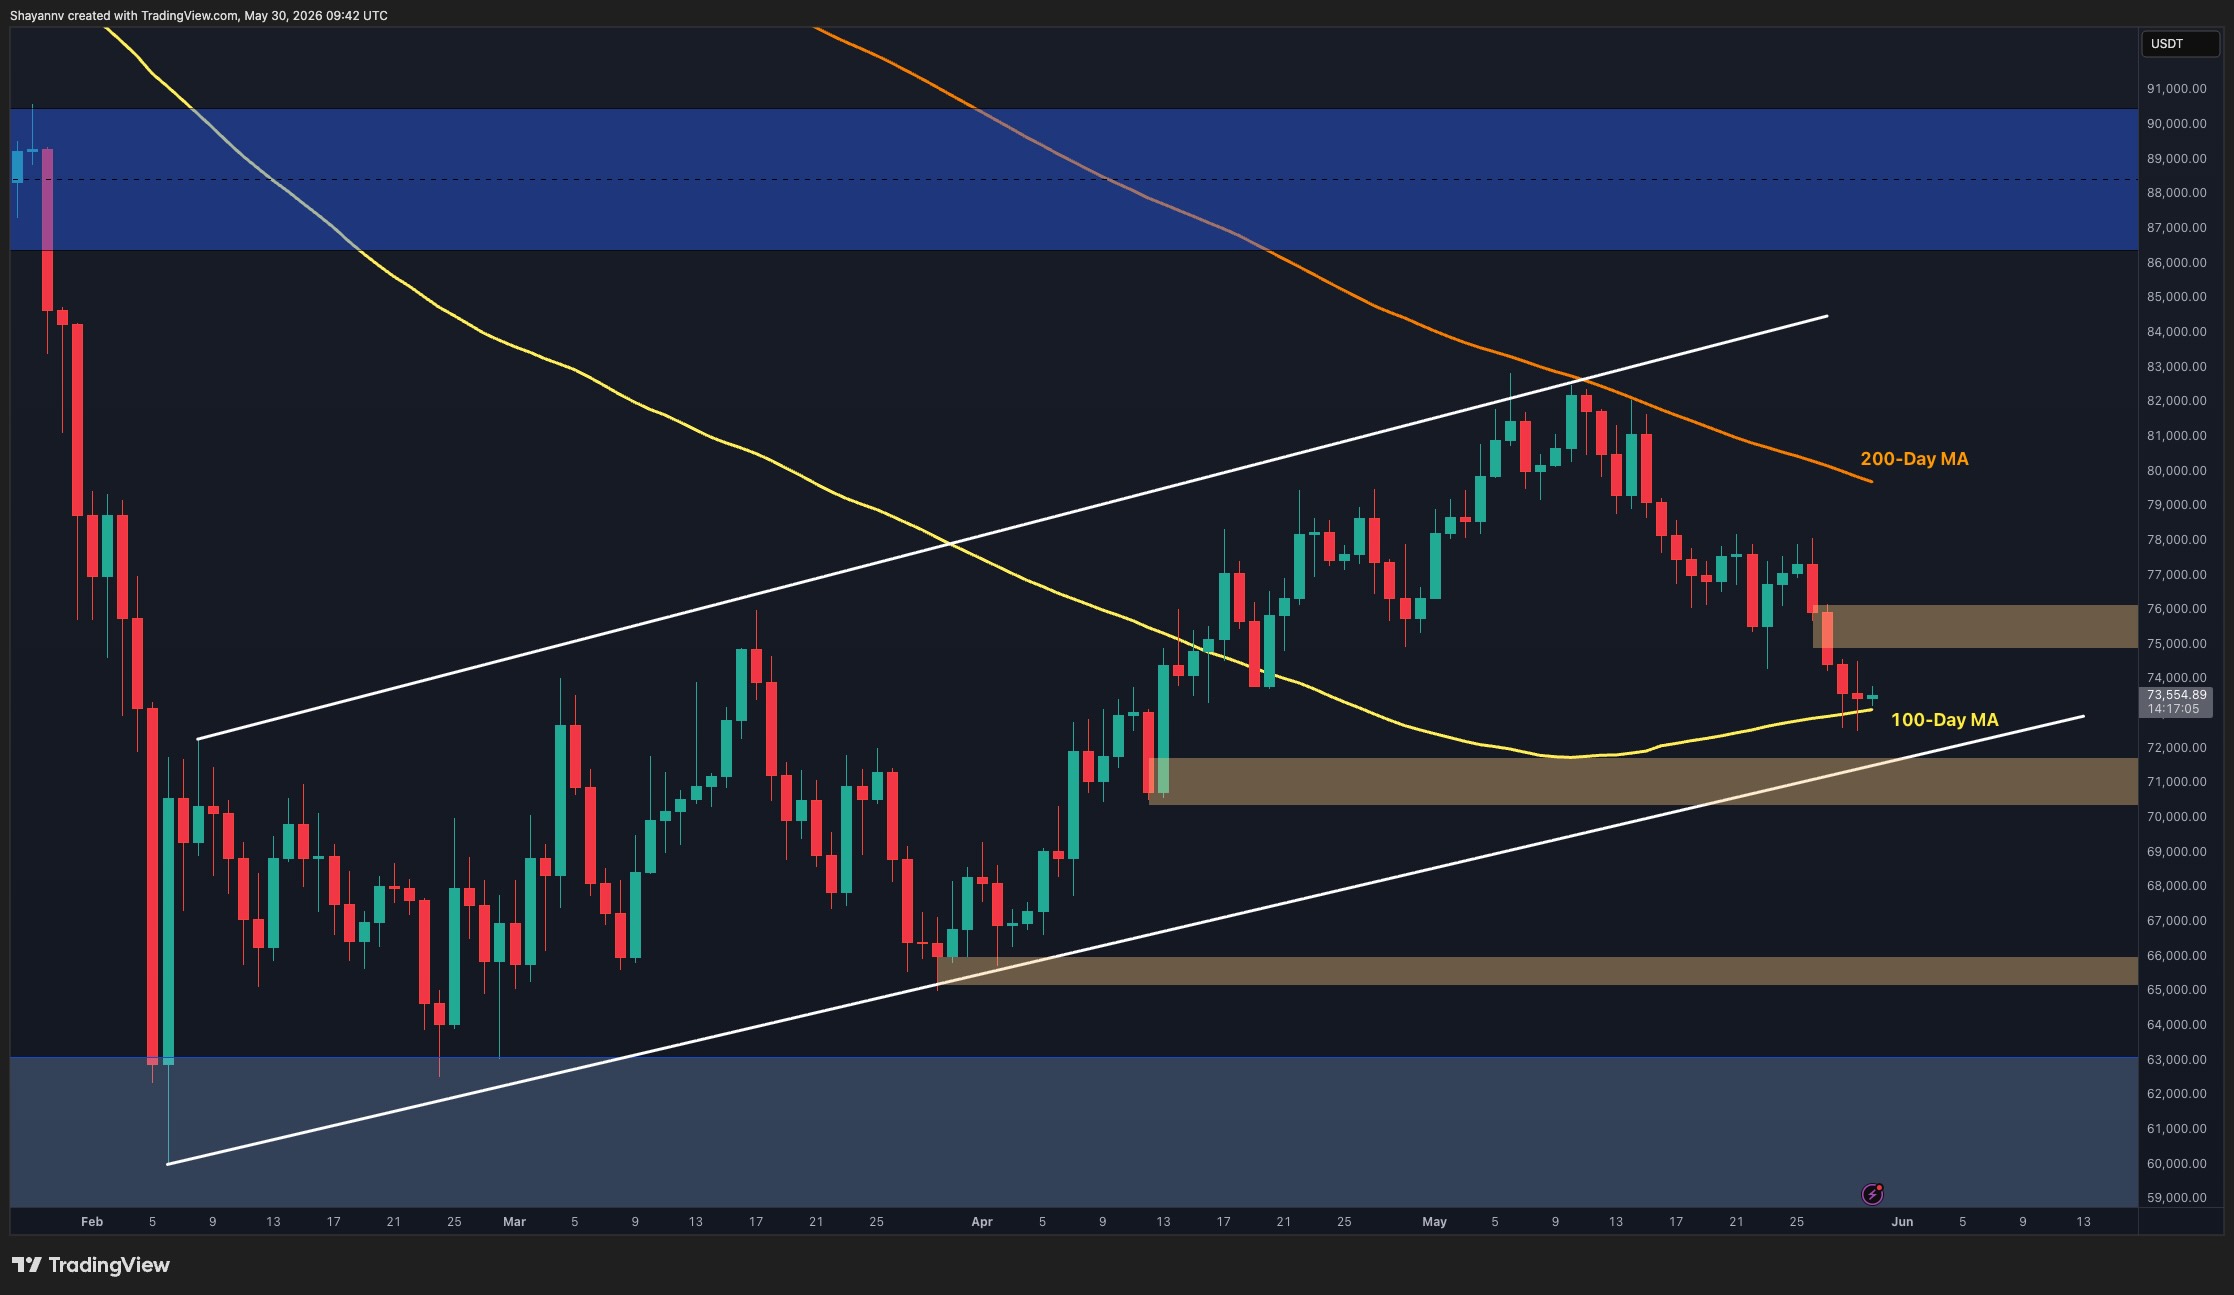
Bitcoin Slips Below Key $73K Support as Bears Eye $70K Demand Zone (BTC Price Analysis)