BTC Spot CVD Chart Analysis: Volume Heatmap and Order Flow Insights for June 17

Share:
On June 17, BTC/USDT traders used a Spot Cumulative Volume Delta (CVD) chart combined with a volume heatmap to map order flow and identify volume clusters as support and resistance, with category lines tracking trade sizes such as $100–$1,000 and institutional $1M–$10M. The analysis shows rising CVD in the large-order bucket signals genuine institutional buying and greater market impact while weak CVD on breakouts suggests false moves, making these tools valuable for short-term crypto trading across CEXs and DEXs but less definitive for long-term adoption or investing.
Predictions Markets
See what traders are focused on

BitcoinWorld
BTC Spot CVD Chart Analysis: Volume Heatmap and Order Flow Insights for June 17
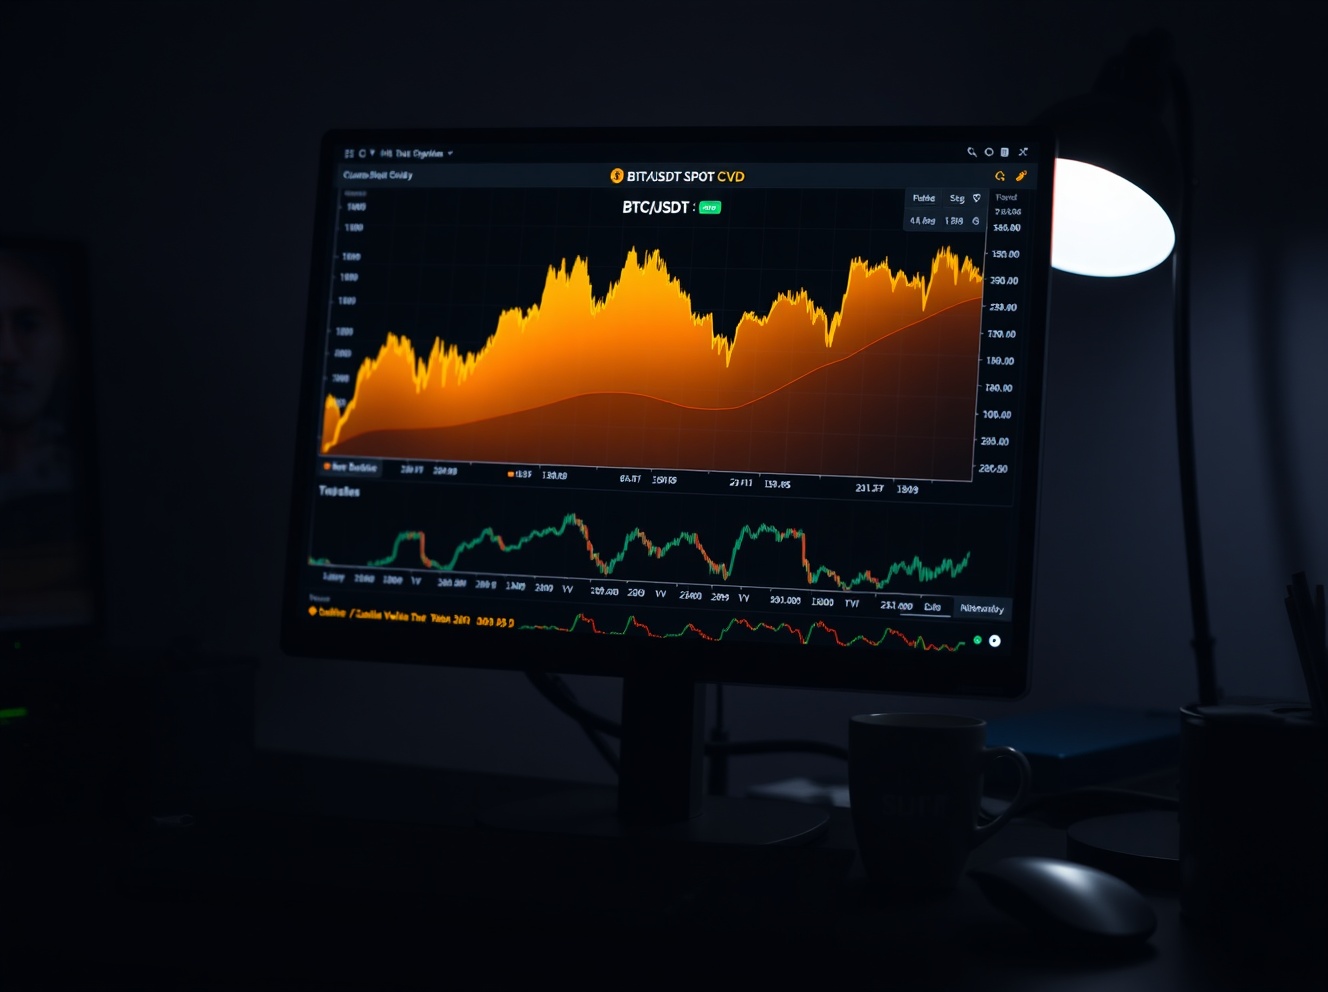
On June 17, traders analyzing the BTC/USDT spot market are closely monitoring the Spot Cumulative Volume Delta (CVD) chart, a tool that provides granular insight into order flow dynamics. The chart combines a Volume Heatmap in the upper section with a CVD indicator below, offering a detailed view of buying and selling pressure at specific price levels.
Understanding the Volume Heatmap
The Volume Heatmap tracks trading activity at various price points. When the price lingers in a particular range or experiences a sharp move, the background color intensifies, highlighting zones of high activity. These brighter areas often serve as potential support or resistance levels, as they represent price points where significant trading volume has occurred. For Bitcoin traders, identifying these levels can help in anticipating price reactions during intraday movements.
What the CVD Indicator Reveals
The CVD indicator categorizes buy and sell orders by trade size, with each category represented by a different colored line. For example, the yellow line tracks orders between $100 and $1,000, while the brown line monitors large institutional-sized orders ranging from $1 million to $10 million. As buying pressure increases within a specific category, its corresponding line rises, offering a real-time snapshot of where capital is flowing. This data is particularly useful for distinguishing between retail and whale activity, providing a clearer picture of market sentiment.
Why This Matters for Bitcoin Traders
Understanding CVD and volume heatmaps helps traders assess the strength behind price movements. For instance, a price breakout accompanied by rising CVD in the large-order category suggests genuine institutional interest, while a breakout with weak CVD may indicate a false move. On June 17, these indicators are providing nuanced signals as Bitcoin consolidates near key levels, making order flow analysis a critical component of short-term trading strategies.
Conclusion
The BTC spot CVD chart remains a valuable resource for traders seeking to decode market structure beyond simple price action. By combining volume heatmaps with cumulative delta data, market participants can better gauge supply and demand dynamics. As of June 17, these tools are helping traders navigate a period of technical uncertainty, with support and resistance levels identified through volume clusters offering actionable insights.
FAQs
Q1: What does a rising CVD line indicate?
A rising CVD line indicates that buy orders are dominating sell orders within a specific trade size category, signaling bullish pressure at that price level.
Q2: How can volume heatmaps improve trading decisions?
Volume heatmaps highlight price levels with high trading activity, which often act as support or resistance. Traders use these zones to set entry and exit points or to anticipate price reversals.
Q3: Is the CVD chart suitable for long-term investing?
The CVD chart is primarily a short-term trading tool, as it focuses on intraday order flow. Long-term investors may find it useful for identifying accumulation or distribution phases but should combine it with broader market analysis.
This post BTC Spot CVD Chart Analysis: Volume Heatmap and Order Flow Insights for June 17 first appeared on BitcoinWorld.


Read More

Bitcoin Spot CVD Analysis: July 8 Order Book Shows Key Support and Resistance Levels