CoinShares analyst debunks Bitcoin death cross as ‘nonsense’

CoinShares head of research James Butterfill called the infamous “Bitcoin death cross” indicator “total nonsense,” citing historical data suggesting that these events often precede positive returns rather than prolonged declines.
Butterfill made the statement in an April 8 post, one day after Bitcoin (BTC) registered a death cross pattern. On April 7, BTC’s 50-day simple moving average (SMA) declined to $86,485.72, falling below the 200-day SMA at $86,839.64.
Assessing 11 past death cross occurrences, Buttefill discovered that BTC usually registers slight losses within one month after the event. However, median and mean values for the following three and six months are positive.
A death cross is a commonly referenced technical signal that indicates potential downward momentum when the 50-day simple moving average falls below the 200-day SMA.
Historical data shows gains rather than collapses
Bitcoin’s returns following past death cross events vary significantly. The dataset includes 11 historical instances dating back to 2011 and measures BTC price changes one month, three months, six months, and 12 months after each previous instance of the event.
One month after a death cross, Bitcoin’s median return was -1.6%, while the average was -3.2%. At the three-month mark, those figures improved to a median of 3.7% and a mean of 13.6%.
Six-month and 12-month returns skewed more favorably, with average returns of 17.0% and 52.3%, respectively, although the median one-year return remained negative at -17.2%.
The divergence in performance highlights the indicator’s inconsistency as a predictive tool. For example, the March 2020 death cross preceded a 450% price increase one year later.
Similarly, the 2011 and 2015 events eventually led to triple-digit returns over the following year, contradicting the signal’s bearish interpretation. Conversely, the 2021 and 2018 death crosses preceded double-digit losses after twelve months.
Butterfill pointed to these mixed results to argue that the pattern lacks empirical reliability. He said:
“For those of you that think the Bitcoin death cross means anything – empirically it’s total nonsense, and in fact often a good buying opportunity.”
The post CoinShares analyst debunks Bitcoin death cross as ‘nonsense’ appeared first on CryptoSlate.
Bitcoin Price Mirrors Global M2 As Crypto Analyst Reveals May Timeline For “Blast Off”

Bitcoin’s price movement is starting to look positive after a brief stretch of crashes on Sunday and Monday. After breaking down to $74,000 on Monday, bearish momentum looked ready to drag Bitcoin’s price down further. However, bulls quickly stepped in to defend the dip. Their aggressive buying has pushed the price back up, with Bitcoin now moving towards the $80,000 level again.
This recent crash is interesting because it aligns almost perfectly with a high-telling metric. This metric not only foreshadowed the crash, but it is now pointing to a powerful upward move for the next Bitcoin rally.
Analyst Says Global M2 Is A Leading Signal For Bitcoin’s Next Move
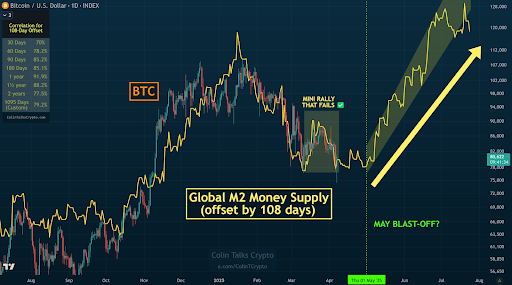
Colin, a well-followed crypto analyst on X, recently drew attention to Bitcoin’s relationship with the global M2 money supply. Taking to social media platform X, the analyst shared a chart showing Bitcoin’s price correlation with the Global M2 Money Supply, although with a 108-day offset. It almost looks like the Global M2 Money Supply is working as a template for Bitcoin’s price action, as the leading cryptocurrency has been tracing this offest almost step by step since August 2024.
In his latest post, Colin explained that Bitcoin continues to “follow Global M2 like glue.” The chart he shared overlays Bitcoin’s candlestick movements with a yellow line representing the M2 supply offset by that duration. The result is a striking correlation that Colin has consistently tracked for over a year.

The chart below highlights what Colin labeled a mini-rally that failed and another crash, which has played out just as M2 had predicted. Now, with Bitcoin starting April with this crash, the M2 indicator suggests that it could very well blast off anytime soon.
However, Colin noted that the price could consolidate further or experience minor dips before the anticipated rally. The analyst noted that the leading cryptocurrency is not fully out of the woods. But if lucky, it will be mostly sideways from here until the blastoff shown by the M2, which is not until May.
May Blast-Off? BTC’s Rally Setup Strengthens Despite Short-Term Crash
Colin’s forecast is based on the idea that Bitcoin could begin a major upward move by early May, which he called a May “blast-off.” The yellow M2 projection curve on his chart shows a steep climb ahead starting from May 1, indicating the possibility of Bitcoin rallying toward $128,000 if the correlation remains intact.
However, the analyst did not forgo the short-term risks that Bitcoin and the entire crypto market might face in April. These short-term risks are based on policy concerns regarding the “Trump tariffs,” which have set the investing markets ablaze in the past few days.
The coming weeks will be important for the outcome of this blastoff. Should it hold above the $78,000–$80,000 level while maintaining alignment with the Global M2 Money Supply, May could usher in the parabolic move Colin is hinting at.
At the time of writing, Bitcoin is trading at $79,255, up by 5.5% in the past 24 hours.
Read More


