Shiba Inu (SHIB) Price On The Verge Of Major Breakout, Here’s Why

Share:
Predictions Markets
See what traders are focused on

Since reaching its peak for the year at $0.00004749 over a month ago, on March 5, the price of Shiba Inu (SHIB) has fallen by approximately 40%. Nonetheless, there may be brighter days ahead. Following a meteoric rise of 390% in just eight days from the end of February till the beginning of March, a period of consolidation was inevitable for the SHIB price. However, this phase could be drawing to a close.
Shiba Inu Price About To Surge 65%?
On the daily chart, the meme coin is exhibiting a critical chart pattern that suggests a significant price movement may be imminent. The analysis of the daily SHIB/USD chart reveals the emergence of a symmetrical triangle pattern. This classic chart pattern is generally considered a continuation pattern, typically heralding an uptick in volatility. Given that SHIB has been on a notably strong uptrend, the momentum could swing back in favor of the bulls.
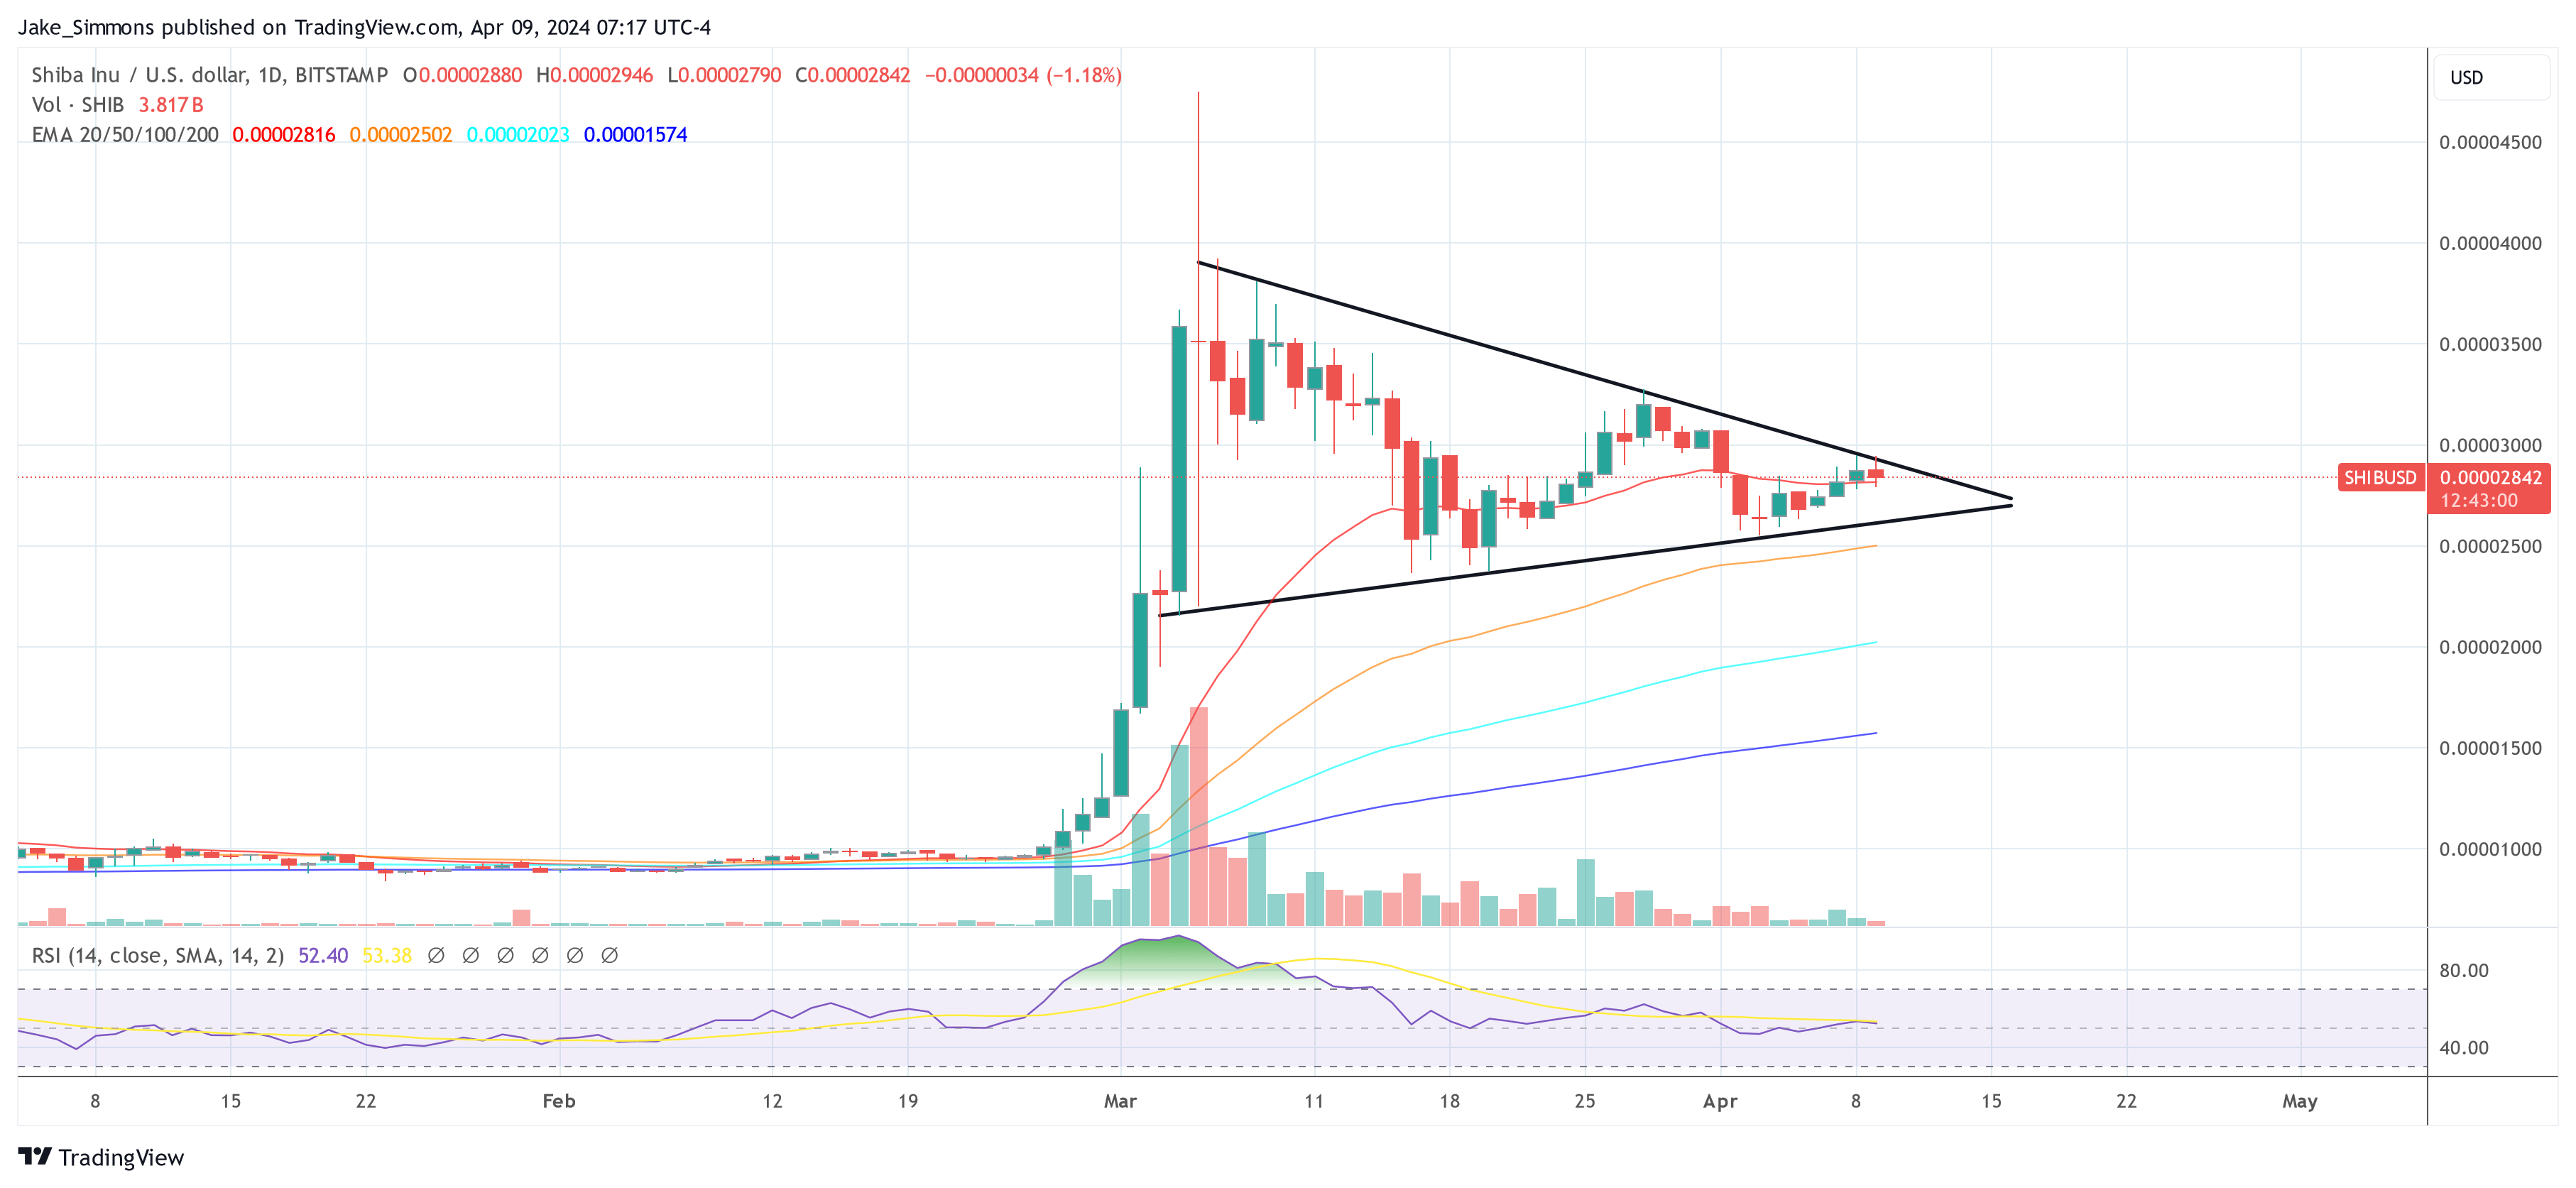
Over the past five weeks, the price of SHIB has been making a series of lower highs and higher lows, which is evident from the converging trend lines that are containing the price action. The apex of the triangle is fast approaching, suggesting that a breakout is imminent. This type of consolidation suggests market indecision, and as the pattern reaches its conclusion, we can expect a significant move in either direction.
The current price at the time of the analysis is $0.00002842. Notably, the volume has been declining as the pattern developed, which is typical during the formation of a symmetrical triangle and further validates the pattern.
Exponential Moving Averages (EMAs) also paint a crucial picture. The 20-day EMA is flatlining, suggesting a neutral short-term trend, while the 50, 100, and 200-day EMAs are all trending upward, providing strong support levels. Particularly, the price is currently above the 20-day EMA, which is positioned at approximately $0.00002817, and this level could act as a strong support in the near term.
The Relative Strength Index (RSI) is hovering near the 52.40 level, which is slightly above the midpoint of 50 that separates bullish momentum from bearish momentum. The RSI level indicates a neutral stance in the market momentum but leaves room for an upward push should the market sentiment sway positively.
In terms of deriving price targets from this pattern, technical analysts typically measure the height of the triangle at its widest part and project that distance from the point of breakout.
If SHIB breaks above the triangle, the price could surge, targeting the height of the triangle, which could be in the region of the yearly high at approximately $0.000048, considering the widest part of the pattern. This would translate into a 65% price rally from the current price. Conversely, a downward breakout could send the price to test the $0.00001500 level, which would be the equivalent target on the downside.
It is important to mention that while symmetrical triangles can lead to a substantial breakout, the direction is not certain until a clear breakout occurs with an accompanying increase in volume. Traders and investors need to watch for a daily close outside of the triangle’s boundaries, with increased volume, to confirm the direction of the breakout.
In This News
Coins

$ 0.00217
-0.48%
$ 0.00544

$ 0.101
-1.62%
$ 0.00...043
-2.06%
$ 0.527


Predictions Markets
See what traders are focused on
Share:
In This News
Coins
$ 0.00217
-0.48%$ 0.00544
$ 0.101
-1.62%$ 0.00...043
-2.06%$ 0.527
Predictions Markets
See what traders are focused on
Share: