U.S. Treasury yields surge to multi-year highs
Share:
Predictions Markets
See what traders are focused on

Treasury bills, commonly referred to as T-bills, are short-term securities issued by the U.S. government. They are essentially IOUs, with the government promising to pay back the face value of the bill upon its maturity. The yield on a Treasury bill represents the return an investor will receive by holding the bill until maturity. Yields move inversely to bond prices; when bond demand increases, prices rise, yields fall, and vice versa.
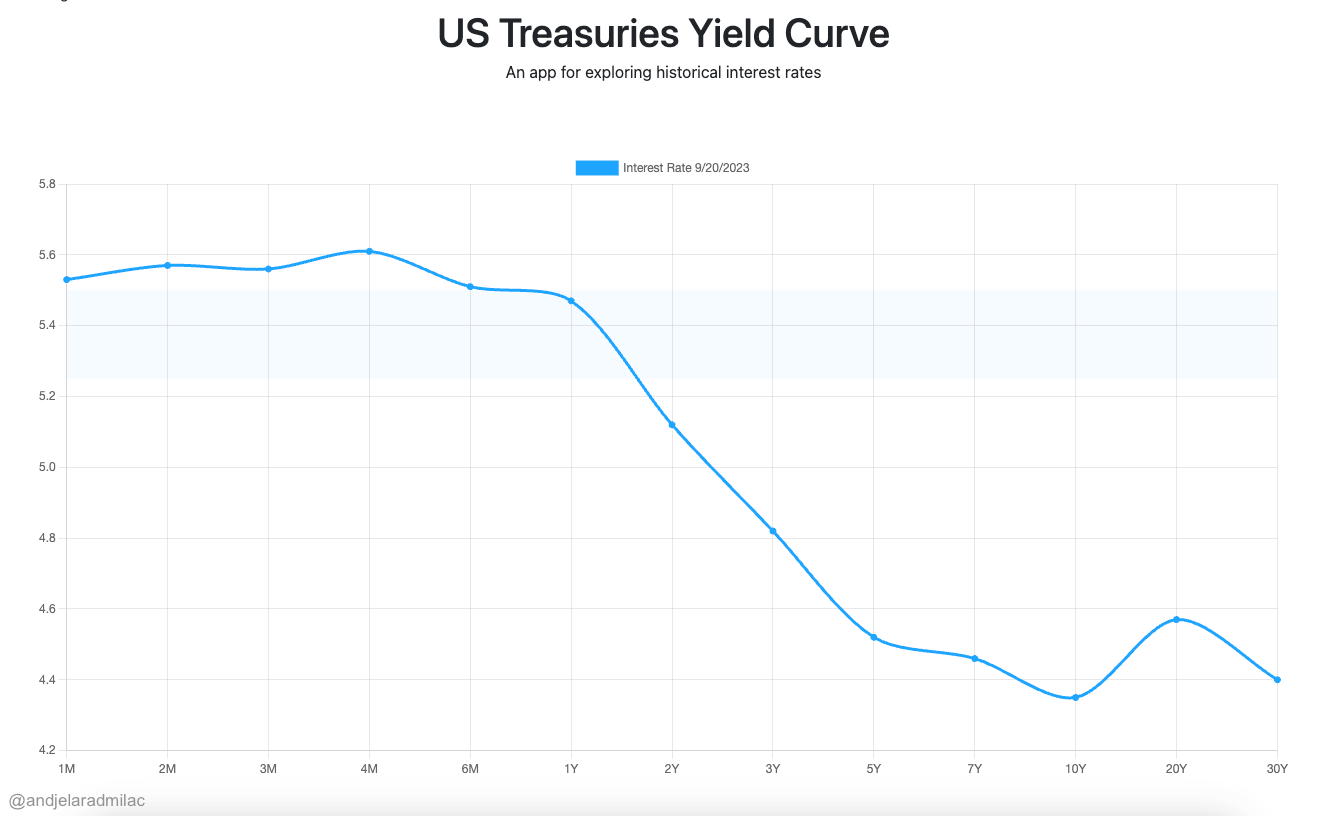
The yield curve, a graphical representation of yields across different maturities, is a crucial market indicator. A normal yield curve slopes upward, indicating higher yields for longer-term bonds compared to shorter-term ones. This reflects the additional risk investors take when lending money over an extended period.
The Federal Reserve’s stance plays a pivotal role in influencing Treasury yields. Recent decisions and announcements from the Fed have indicated a hawkish tilt, with potential interest rate hikes on the horizon. Economic indicators, such as inflation rates, unemployment figures, and GDP growth, also play a part in determining yields. On the global front, geopolitical tensions, trade dynamics, and global economic health can sway U.S. Treasury yields.
Recent data indicates that yields on nearly all Treasury bills have surged to multi-year highs:
- 3-Month Treasury Bill: The current yield stands at 5.47%, which has seen an increase of 4 basis points in the past month and a significant rise of 221 basis points over the past year.
- 6-Month Treasury Bill: The yield is currently at 5.52%. Over the last month, it has risen by 3 basis points and has surged by 164 basis points year-over-year.
- 12-Month Treasury Bill: It has a yield of 5.47%, with an increase of 10 basis points in the last month and a rise of 142 basis points from the previous year.
- 2-Year Treasury: The yield is at 5.15%. It has seen an increase of 17 basis points in the past month and has grown by 113 basis points over the last year.
- 5-Year Treasury: Currently, the yield is 4.62%, with a month-over-month increase of 16 basis points and a year-over-year rise of 86 basis points.
- 10-Year Treasury: The yield stands at 4.48%. It has grown by 14 basis points in the last month and has seen a rise of 95 basis points from the previous year.
- 30-Year Treasury: The current yield is 4.53%, with an 8 basis point increase in the past month and a significant growth of 102 basis points year-over-year.
| DURATION | YIELD | 1-MONTH BASIS POINT INCREASE | 1-YEAR BASIS POINT INCREASE |
|---|---|---|---|
| 3 Month | 5.47% | +4 | +221 |
| 6 Month | 5.53% | +3 | +164 |
| 12 Month | 5.46% | +9 | +142 |
| 2 Year | 5.14% | +15 | +110 |
| 5 Year | 4.62% | +16 | +86 |
| 10 Year | 4.48% | +15 | +96 |
| 30 Year | 4.55% | +10 | +104 |
The 2-year Treasury note is uniquely positioned in the financial landscape, often serving as a barometer for short-to-medium-term economic expectations. Its shorter duration makes it more sensitive to changes in the Federal Reserve’s monetary policy and anticipated shifts in interest rates. When the Federal Reserve signals potential rate hikes or adopts a hawkish stance, the 2-year yield can react more swiftly than longer-dated bonds.
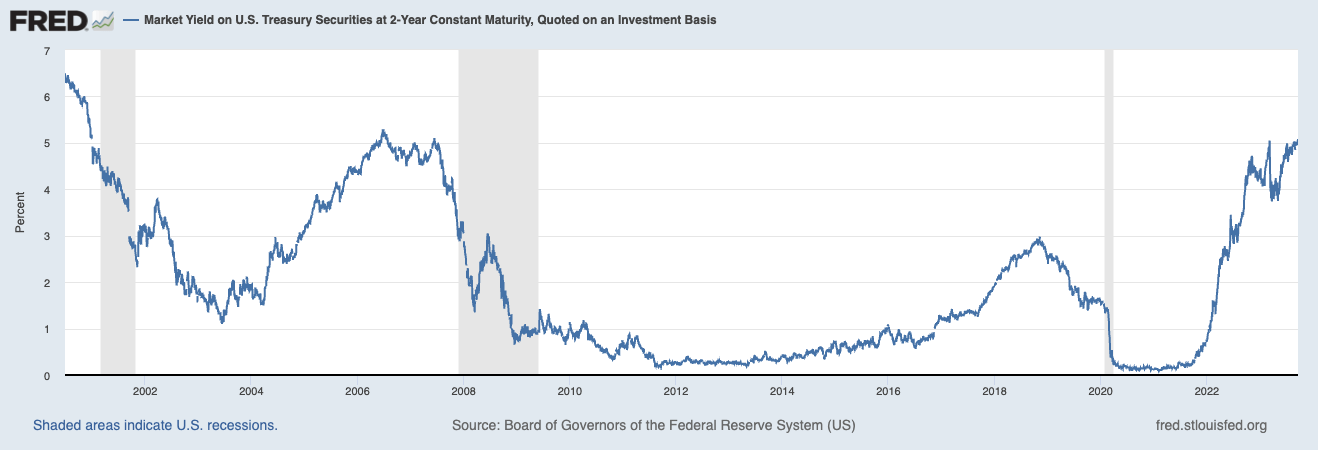
This sensitivity makes the 2-year Treasury a critical indicator for investors trying to gauge the economy’s direction and the central bank’s next moves. The recent significant increase in the 2-year Treasury yield underscores its role as a bellwether for imminent economic and policy shifts.
Rising Treasury yields can be a double-edged sword for the crypto market, particularly Bitcoin. On one hand, as traditional investments like bonds become more attractive due to higher yields, investors might pivot away from riskier assets like cryptocurrencies. On the other hand, some view Bitcoin as a hedge against inflation, and if rising yields indicate inflationary pressures, it could bolster Bitcoin’s appeal.
The post U.S. Treasury yields surge to multi-year highs appeared first on CryptoSlate.


Read More

Bitcoin price shows resilience above $60,000 amid renewed US-Iran hostilities
