Something Else Is Moving Bitcoin — Here’s What The Charts Reveal
Share:
Predictions Markets
See what traders are focused on

Bitcoin’s latest pullback has little to do with crypto-native flows and everything to do with the dollar, according to chief crypto analyst at Real Vision Jamie Coutts.
Sharing two charts on X, Coutts argued that a rebound in the US Dollar Index (DXY) is briefly tightening global liquidity and pressuring risk assets across the board. “Bitcoin’s dip isn’t mysterious — it’s macro,” he wrote.
Why Is Bitcoin Down?
“The dollar’s rebound is tightening global liquidity. DXY is retesting 100–101 — a key resistance and natural mean-reversion zone after one of the sharpest declines in decades in 1H25. Positioning had become crowded on the short side, so a bounce was always likely. The real question: is this the start of a new dollar cycle or just the setup for the next leg lower? Base case: liquidity tailwinds and an improving business cycle keep the outlook for risk assets bullish into mid-2026,” he added.
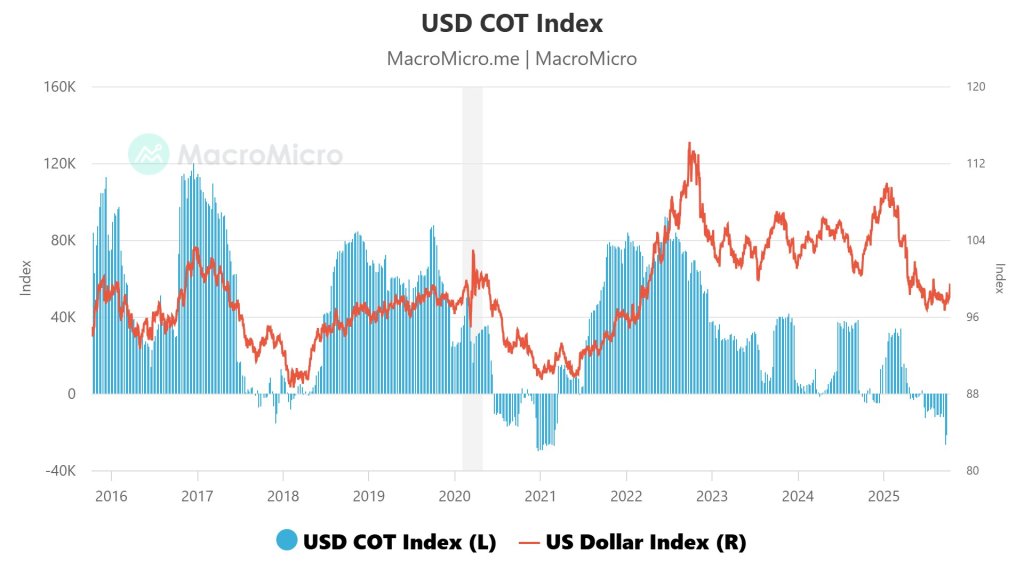
The first chart he shared juxtaposes the USD COT Index with the US Dollar Index. After a prolonged slide in 1H25, speculative positioning flipped aggressively against the dollar, with the COT index sinking into negative territory in mid-2025.
That capitulative stance created fertile conditions for a counter-trend squeeze. The price panel shows DXY clawing back toward the 100-101 area—a zone that lines up with prior congestion and the underside of this year’s breakdown—while the COT bars remain below zero, consistent with short-covering dynamics rather than a fully rebuilt long-dollar consensus.
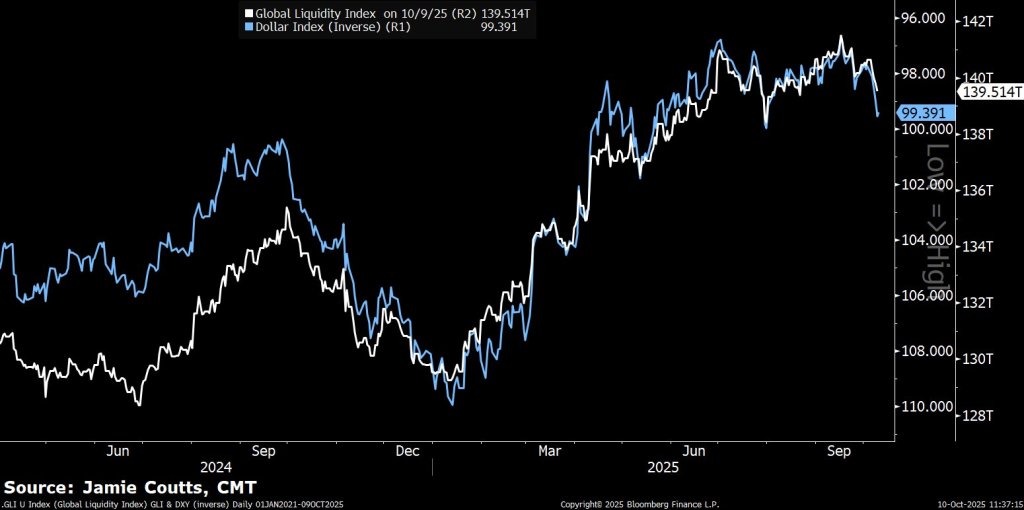
Coutts’ second chart overlays the Global Liquidity Index with the inverse of DXY. The series track each other closely: when the dollar weakens (inverse DXY rises), the global liquidity proxy rises too, historically coinciding with stronger performance for duration-sensitive risk assets such as equities and crypto.
Over recent weeks, the white liquidity line has rolled over modestly as the blue inverse-DXY line has done the same, illustrating the transmission mechanism Coutts highlights: a firmer dollar equals tighter global dollar liquidity at the margin, which in turn dents risk appetite and crypto beta.
What This Means For BTC Price
Framed this way, Bitcoin’s slip is a straightforward function of FX mean reversion and futures positioning, not a breakdown in crypto’s structural flows. The “crowded short” in dollar futures telegraphed vulnerability to a bounce, and the mean-reversion target around 100–101 offered a logical waypoint for that move.
If DXY stalls and resumes lower from that band—consistent with the broader 2025 downtrend—liquidity conditions would likely ease again, restoring the bid under high-beta assets. If, instead, the index pushes through and holds above that zone, Bitcoin would be contending with a more durable dollar impulse and a slower return of positive liquidity momentum.
Coutts’ “base case” remains constructive despite the near-term headwind: an improving global business cycle and continued liquidity tailwinds into mid-2026. In that framework, Bitcoin’s drawdowns on dollar strength look cyclical, not secular. The immediate pivot point sits in plain view on his charts: the DXY’s 100–101 retest, born from stretched speculative shorts and classic mean reversion, is dictating BTC’s temperature for now.
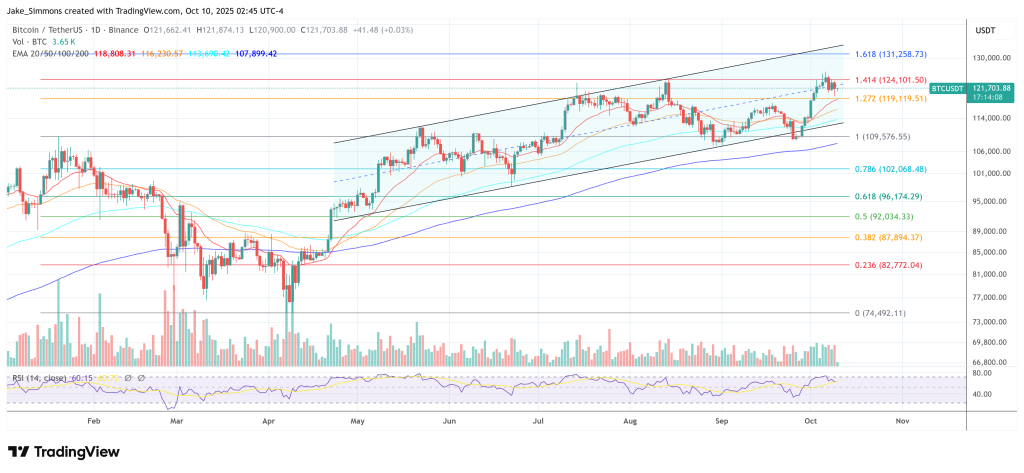
At press time, Bitcoin traded at $121,703.


Read More

Coinbase Builds Post-Quantum Custody System, Funds Bitcoin’s Crypto Upgrade