Veteran Trader Warns Of ‘Textbook’ XRP Crash Pattern

Share:
Predictions Markets
See what traders are focused on

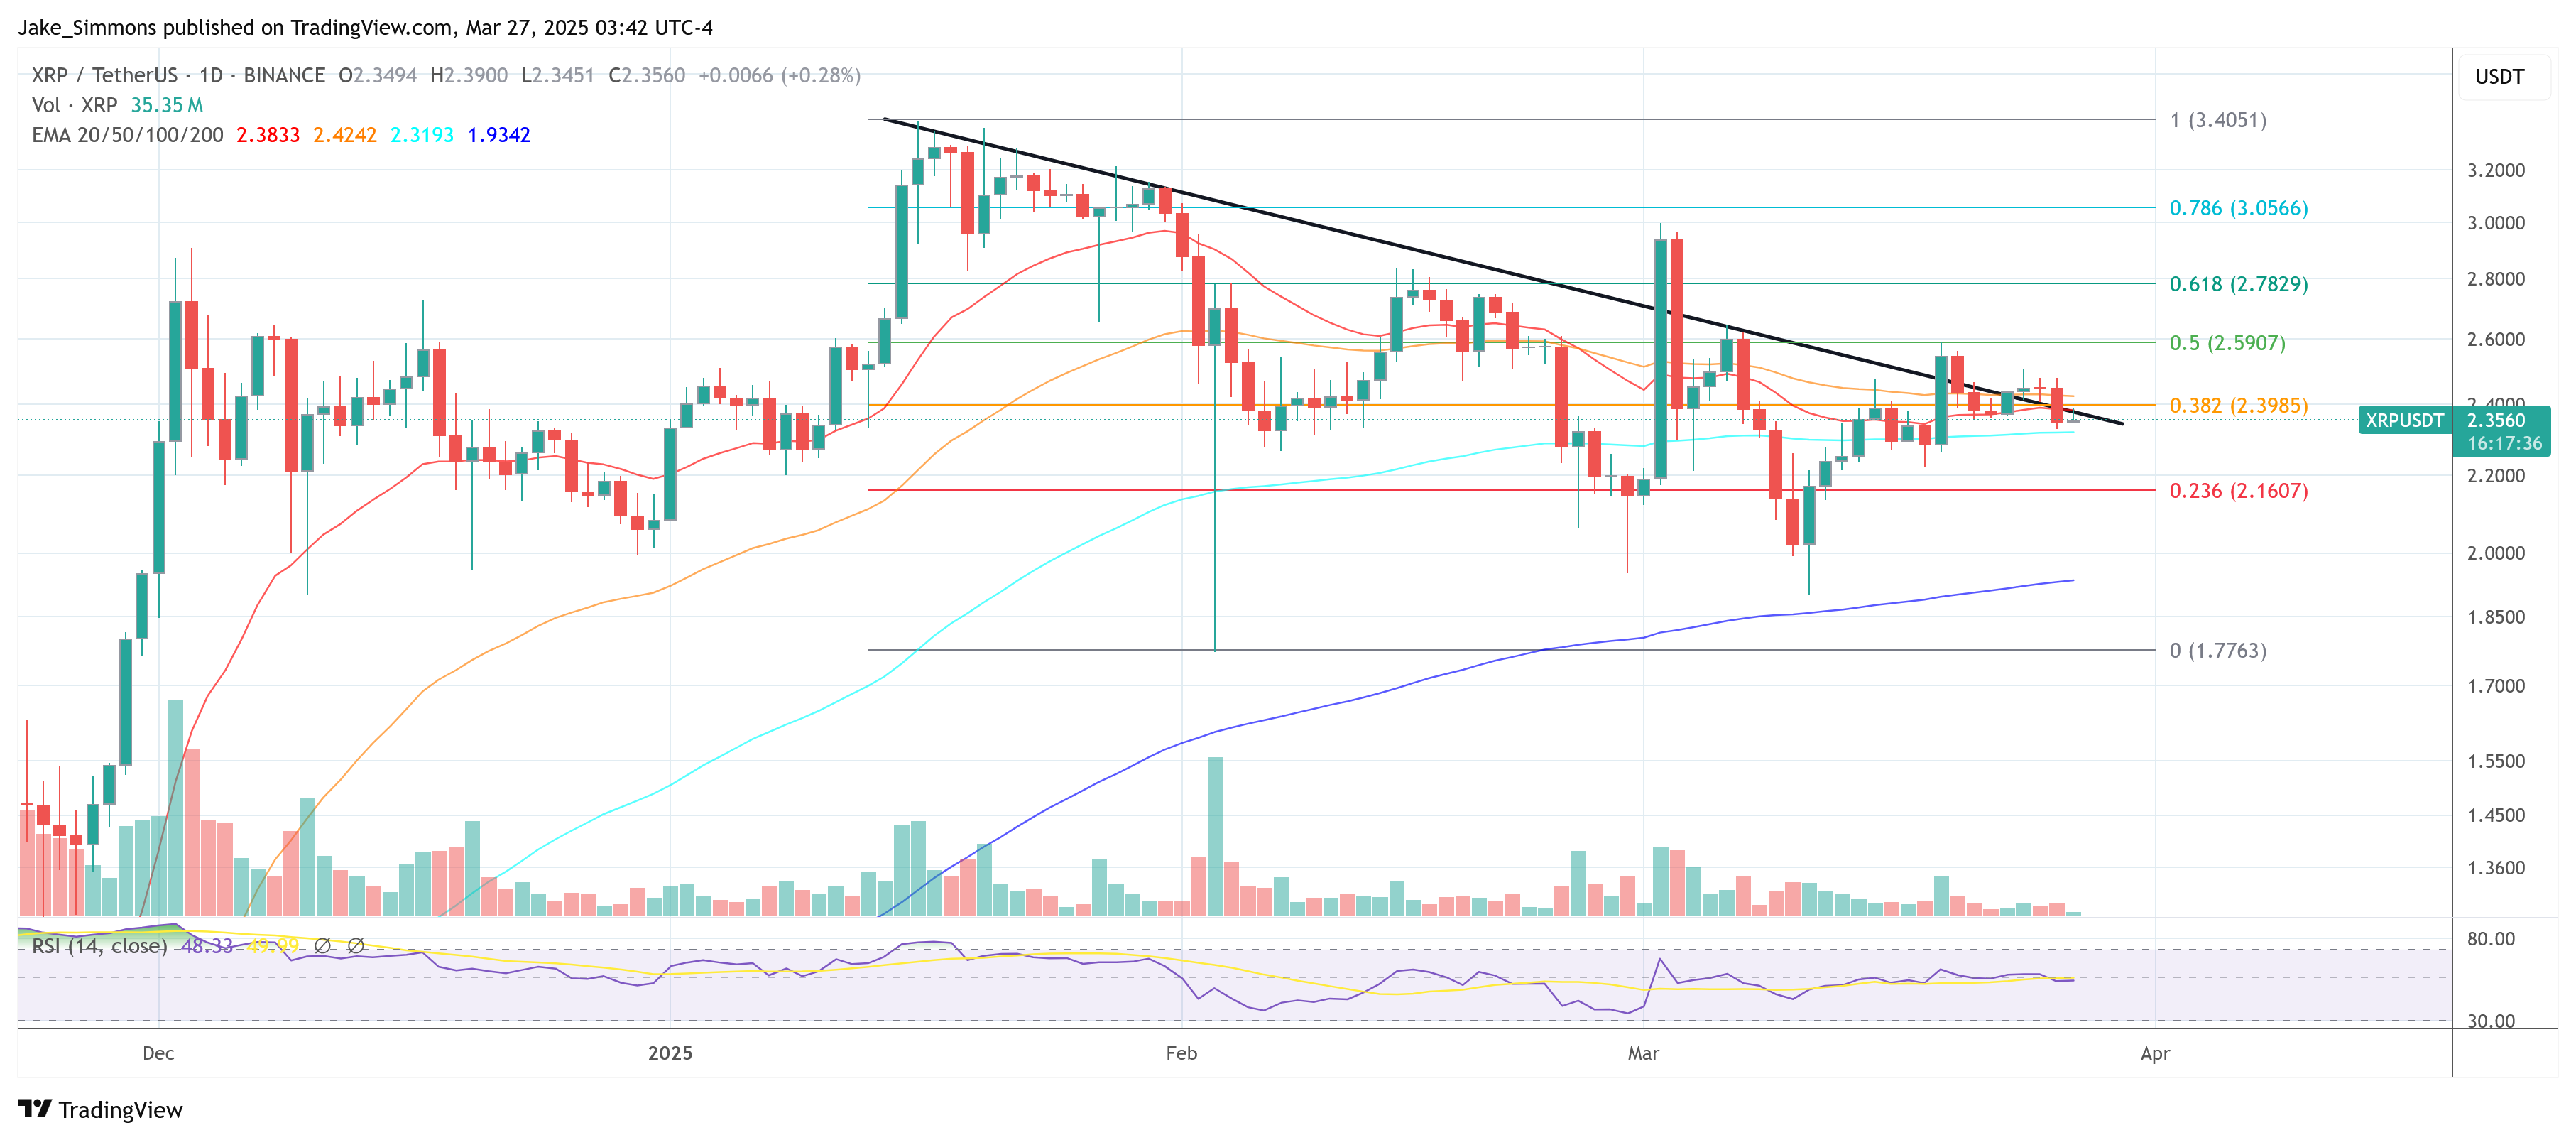
In an update posted via X, veteran market analyst Peter Brandt shared a striking technical outlook for XRP/USDT, identifying a classic Head & Shoulders (H&S) formation in the daily chart that points to a possible retracement toward the $1.07 region.
Brandt’s chart tracks XRP daily bars from mid‐October through late March on Binance. The XRP surged from below $0.50 in late October to above $1.00 in mid‐November. After forming a bull flag, the asset continued aggressively higher, building a local top around $2.90 in early December before starting the last leg up as high as $3.40 in mid-January.
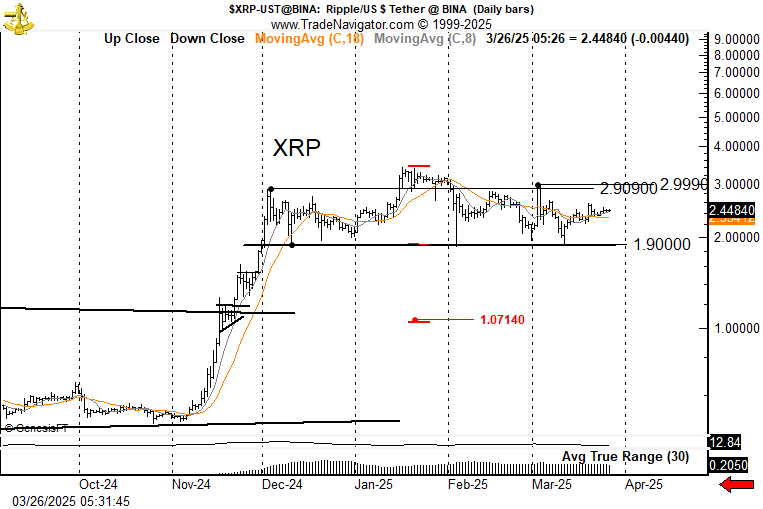
The 8‐day (C,8) and 18‐day (C,18) moving averages—shown in orange and black, respectively—now hover around the $2.44 mark, where the price is currently sitting.
XRP Could Crash If This Happens
Two notable horizontal levels frame the current trading zone. First is the $1.90 floor, which serves as the approximate neckline for the H&S pattern and has repeatedly acted as support. Second is the $2.90–$2.99 ceiling, a clear horizontal resistance band where XRP has struggled to sustain upward momentum.
Brandt states that a decisive break below $1.90 “would not be ideal for longs,” while any upside breach above $3.00 could force short sellers to reconsider their positions. On the chart, the left shoulder formed near the $2.90 handle, followed by a higher peak at $3.40, creating the “head.”
Subsequently, the right shoulder emerged closer to the $3.00 zone. The neckline sits around $1.90. If XRP breaks below that neckline with sufficient volume, Brandt’s measured‐move target suggests a decline to approximately $1.07. He labels this price objective with a red arrow, signaling the potential downside risk inherent in classical H&S patterns.
Brandt’s 8‐day and 18‐day moving averages converge around $2.44, indicating muted momentum at current levels. The 30‐day Average True Range (ATR) measures near $0.205, implying that daily price swings have compressed compared to the explosive action seen during XRP’s ascent from late 2024 through early 2025. Still, a break beyond $3.00 or below $1.90 could spark a renewed surge in volatility.
Brandt emphasizes his lack of a personal stake in XRP, explaining that he is merely relaying what he views as a “textbook” bearish pattern: “I have no vested interest up or down. XRP is forming a textbook H&S pattern. So, we are now range bound. Above $3.000 I would not want to be short. Be”low $1.9 I would not want to own it. H&S projects to $1.07. Don’t shoot the messenger.
At press time, XRP traded at $2.35.
In This News
Coins

$ 1.11
+1.42%
$ 0.99923
+0.02%
$ 0.00722
-0.54%
$ 0.00...361

$ 0.00085


Predictions Markets
See what traders are focused on
Share:
In This News
Coins
$ 1.11
+1.42%$ 0.99923
+0.02%$ 0.00722
-0.54%$ 0.00...361
$ 0.00085
Predictions Markets
See what traders are focused on
Share:
Read More
XRP climbed above $1.10 as open interest hit 2.14 billion despite $7 billion ETF outflows