Ethereum Price Signals Bearish Rection, Why ETH Could Drop 5%

Share:
Predictions Markets
See what traders are focused on

Ethereum price is struggling to clear the $2,300 resistance zone. ETH is showing a few bearish signs and might decline toward the $2,080 support.
- Ethereum is still struggling to clear the $2,280 and $2,300 resistance levels.
- The price is trading below $2,260 and the 100-hourly Simple Moving Average.
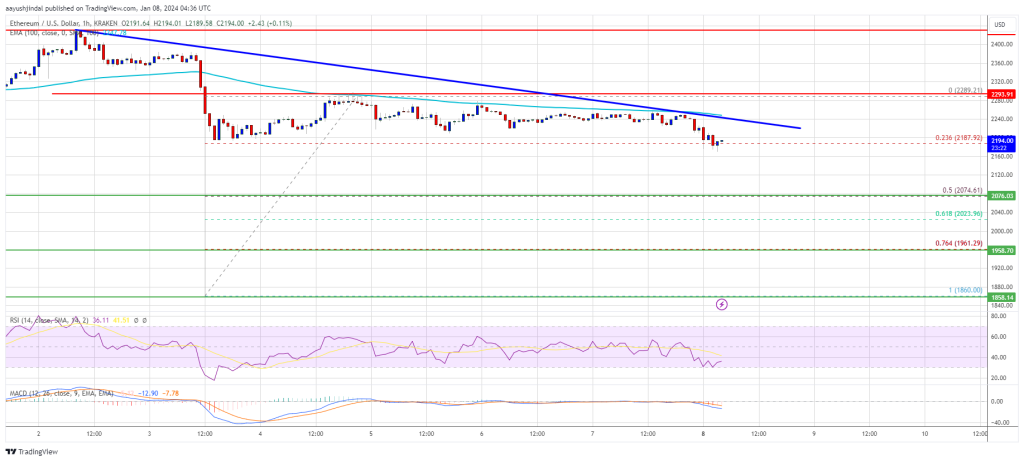
- There is a connecting bearish trend line forming with resistance near $2,240 on the hourly chart of ETH/USD (data feed via Kraken).
- The pair could extend its decline if it stays below the $2,300 resistance zone.
Ethereum Price Faces Major Hurdle
Ethereum price attempted a fresh increase above the $2,200 level, like Bitcoin. ETH climbed above the $2,250 and $2,260 levels. However, the bears were active near $2,300 and the 100-hourly Simple Moving Average.
A high was formed near $2,289 and the price recently saw a bearish reaction. There was a move below the $2,250 level. The price traded below the 23.6% Fib retracement level of the upward wave from the $1,860 swing low to the $2,289 high.
Ethereum is now trading below $2,260 and the 100-hourly Simple Moving Average. There is also a connecting bearish trend line forming with resistance near $2,240 on the hourly chart of ETH/USD.
If there is a fresh increase, the price might face resistance near the $2,250 level and the trend line. The first major resistance is now near $2,280. The next major hurdle sits at $2,300.
Source: ETHUSD on TradingView.com
A close above the $2,300 resistance could start a decent upward move. The next key resistance is near $2,400. If the bulls push Ethereum above $2,400, there could be a rally toward $2,500. Any more gains might send the price toward the $2,620 zone.
More Losses in ETH?
If Ethereum fails to clear the $2,250 resistance, it could start a fresh decline. Initial support on the downside is near the $2,120 level.
The first key support could be the $2,080 zone or the 50% Fib retracement level of the upward wave from the $1,860 swing low to the $2,289 high. A downside break and a close below $2,080 might spark strong bearish moves. In the stated case, Ether could test the $2,020 support. Any more losses might send the price toward the $1,960 level.
Technical Indicators
Hourly MACD – The MACD for ETH/USD is gaining momentum in the bearish zone.
Hourly RSI – The RSI for ETH/USD is now below the 50 level.
Major Support Level – $2,080
Major Resistance Level – $2,280
In This News
Coins

$ 63.80K
+1.03%
$ 1.79K
+2.24%
$ 0.00...361

$ 0.00643

$ 213.96


Predictions Markets
See what traders are focused on
Share:
In This News
Coins
$ 63.80K
+1.03%$ 1.79K
+2.24%$ 0.00...361
$ 0.00643
$ 213.96
Predictions Markets
See what traders are focused on
Share:
Read More

U.S. Government Moves $7.2 Million in Seized Ethereum From BTC-E Wallet