Bitcoin Cash (BCH) in Tug-of-War Mode: Where Does the Price Go From Here?

Share:
Predictions Markets
See what traders are focused on

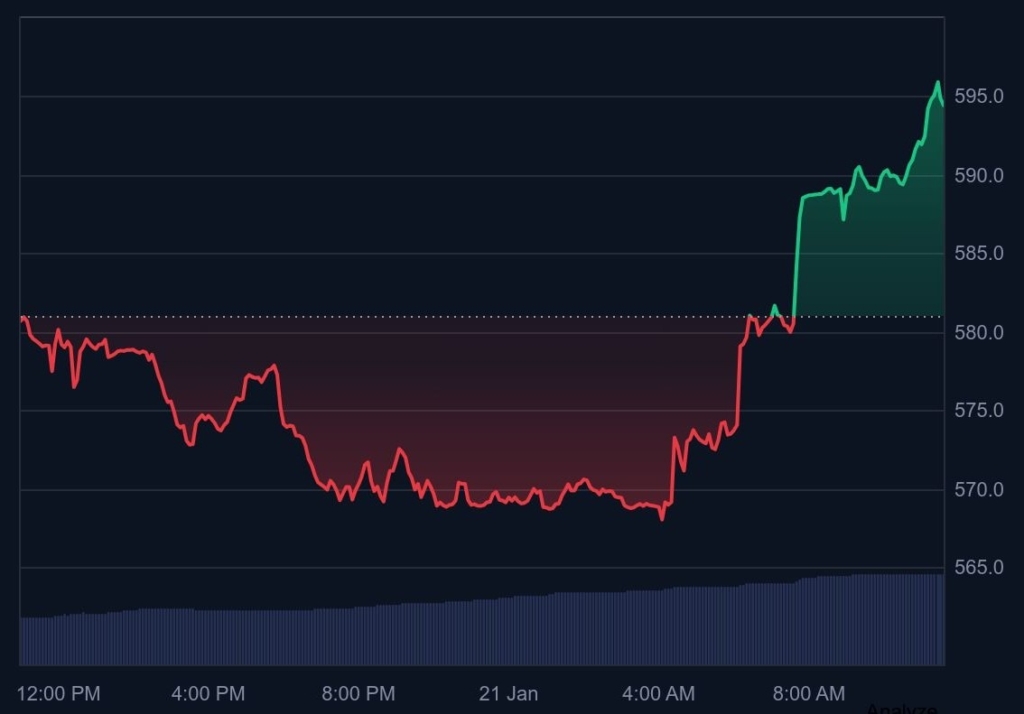
- Bitcoin Cash currently trades at $594.
- BCH’s trading volume has surged by over 91%.
The broader sentiment across crypto tokens has shifted from neutral to fear, as the market slipped by over 3.23%. All the price charts are painted blood-red, with selling pressure mounting and bearish forces running the show. The dominant assets, like Bitcoin (BTC) and Ethereum (ETH), have retreated to prior lows.
Meanwhile, Bitcoin Cash (BCH) has seen multiple ups and downs, and it opened the day trading at $580. The asset has pulled the price back to a bottom of $567.96, and gradually, with a brief bullish shift, the price rose to a high of $590.82. Currently, BCH trades at $594.06, after a 2.86% spike. The daily trading volume increased by 91.21% to $560.81 million.
Upon zooming in on the four-hour trading pattern, the Bitcoin Cash price could fall to the key support at around $590.21. With a deeper bearish correction, it triggers the emergence of the death cross, and the bears would send the price below the $586.74 mark.
On the upside, if Bitcoin Cash reversed the active momentum, the price might climb to the nearest resistance at the $598.38 level. Assuming the bulls potentially gained more traction, the golden cross could take place, likely rising above the $602.49 range.
Are Technical Charts Turning Bearish for Bitcoin Cash?
The technical analysis of Bitcoin Cash exhibits a negative outlook as both the Moving Average Convergence Divergence and signal lines are settled below the zero line. With the bearish momentum, it trades below its longer-term trend. Any bounce is corrective unless the MACD moves back above zero.
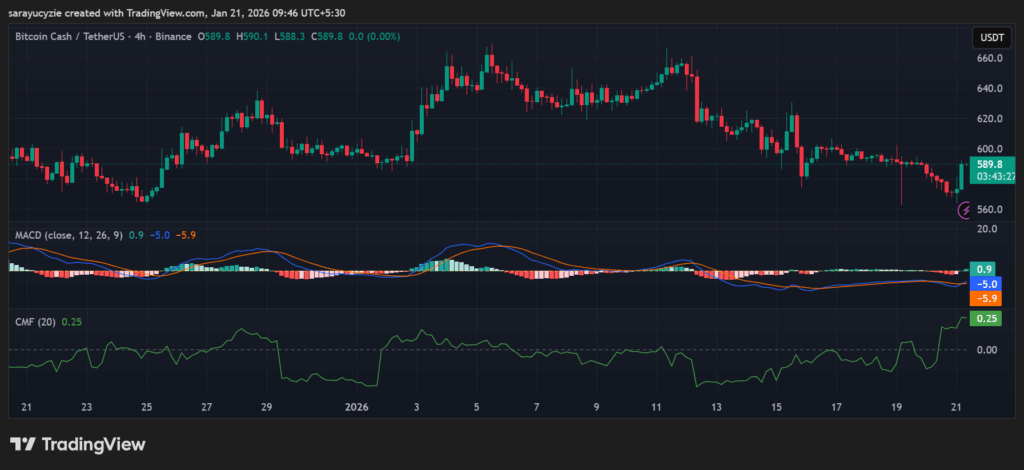
In addition, the Chaikin Money Flow (CMF) indicator reached the 0.25 zone, which implies strong buying pressure in the BCH market. The capital inflows are outpacing outflows, showing accumulation and pointing to the bullish side. If this is sustained, it will support price stability and further upside.
Also, Bitcoin Cash’s daily Relative Strength Index (RSI) is positioned at 52.50 indicates a neutral market stance. Significantly, the ongoing momentum is balanced, with neither the bulls nor the bears in clear control. Furthermore, the Bull Bear Power (BBP) reading of BCH resting at 12.5 suggests mild bullish dominance in the market. A rising value may strengthen the bullish pressure, while a drop back toward zero would hint at consolidation.
Top Updated Crypto News
US Wall Street Indexes Plunge, Triggers Crypto Market Decline as BTC Leads
In This News
Coins

$ 64.06K
-0.10%
$ 1.82K
+0.31%
$ 244.66
-1.13%

Funds

Predictions Markets
See what traders are focused on
Share:
In This News
Coins
$ 64.06K
-0.10%$ 1.82K
+0.31%$ 244.66
-1.13%Funds
Predictions Markets
See what traders are focused on
Share:
Read More

ZachXBT Explains Why LAB Token Crashed Nearly 100%