XRP Price Prediction: Can XRP’s Rarest Monthly Buy Signal Overcome Fading ETF Flows?
Share:
XRP traded at $1.0296 on August 10, compressing against the Bollinger Band lower boundary at $1.01 with all four EMAs still overhead, indicating near-term technical pressure. Analyst Ali Charts flagged a rare Tom DeMark monthly buy signal that preceded 1,074% and 973% rallies in 2020 and 2022, and whales accumulated 380M XRP in a week even as weekly ETF inflows fell to $1.01M, the lowest in months, highlighting bullish accumulation amid fading ETF flows and mixed technicals for crypto and DeFi traders.
Predictions Markets
See what traders are focused on

- XRP trades at $1.0296 on August 10, pressing the Bollinger Band lower boundary at $1.01 with all four EMAs still overhead
- Analyst Ali Charts flagged a Tom DeMark monthly buy signal that previously preceded rallies of 1,074% and 973% on XRP
- Whales accumulated 380M XRP in a week as weekly ETF inflows fell to just $1.01M, the lowest in months
The XRP price prediction is leaning on a signal that’s only fired twice before, both times ahead of four-digit rallies. Analyst Ali Charts flagged a Tom DeMark Sequential buy on XRP’s monthly chart, the same setup that preceded 1,074% and 973% moves in 2020 and 2022
XRP Price Analysis: Bollinger Band Lower Boundary Is the Last Line Before $1
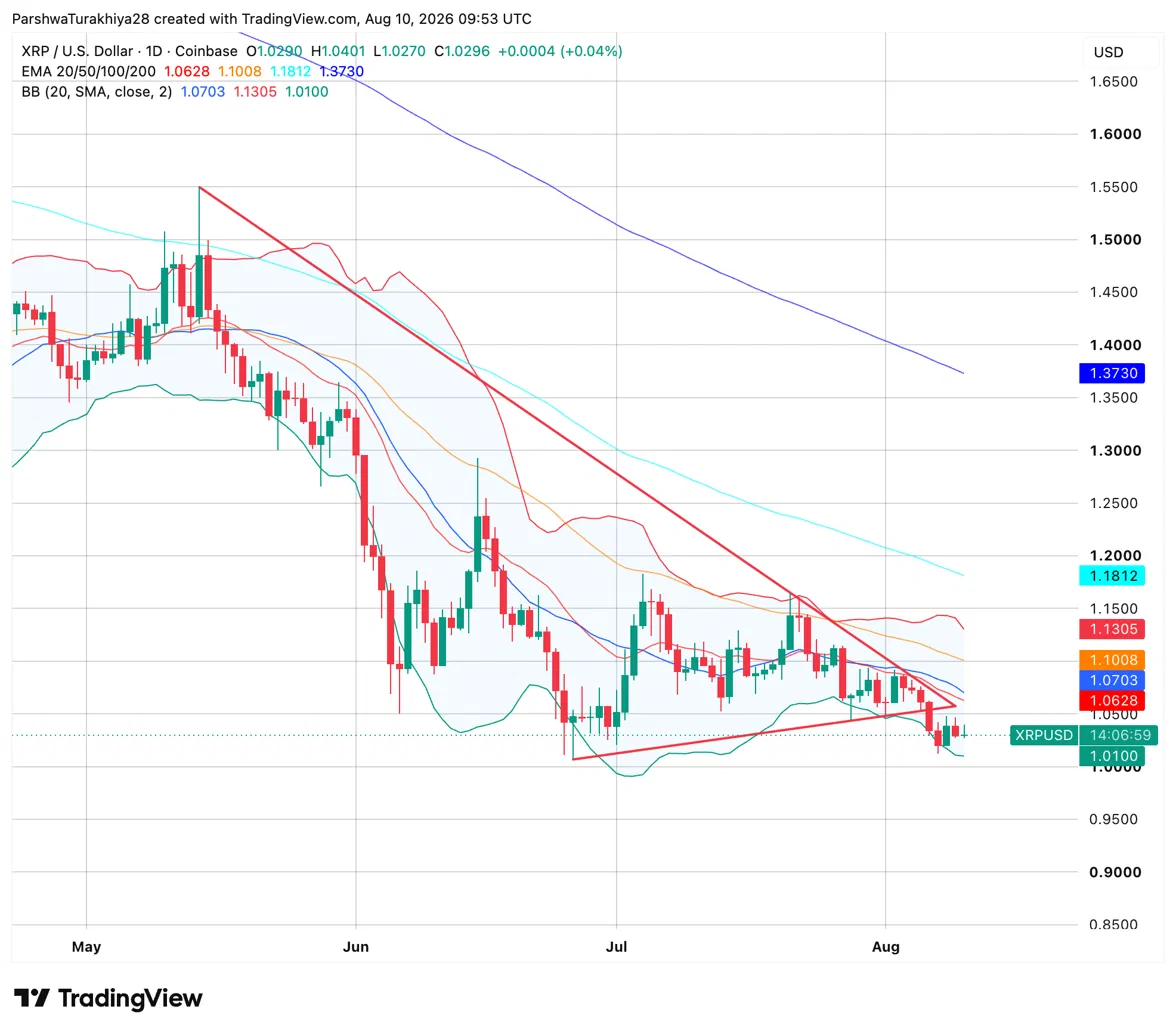
The daily chart shows XRP compressing near the bottom of its range, with the Bollinger Band lower boundary at $1.01 as the last meaningful technic…
Read The Full Article XRP Price Prediction: Can XRP’s Rarest Monthly Buy Signal Overcome Fading ETF Flows? On Coin Edition.


Predictions Markets
See what traders are focused on
Share:
Predictions Markets
See what traders are focused on
Share:
Read More

Ethereum Price Prediction: Is ETH Quietly Setting Up the Biggest Move of the Year?