Bitcoin Price Analysis: Is BTC Ready for Another Leg Higher Next Week?
Share:
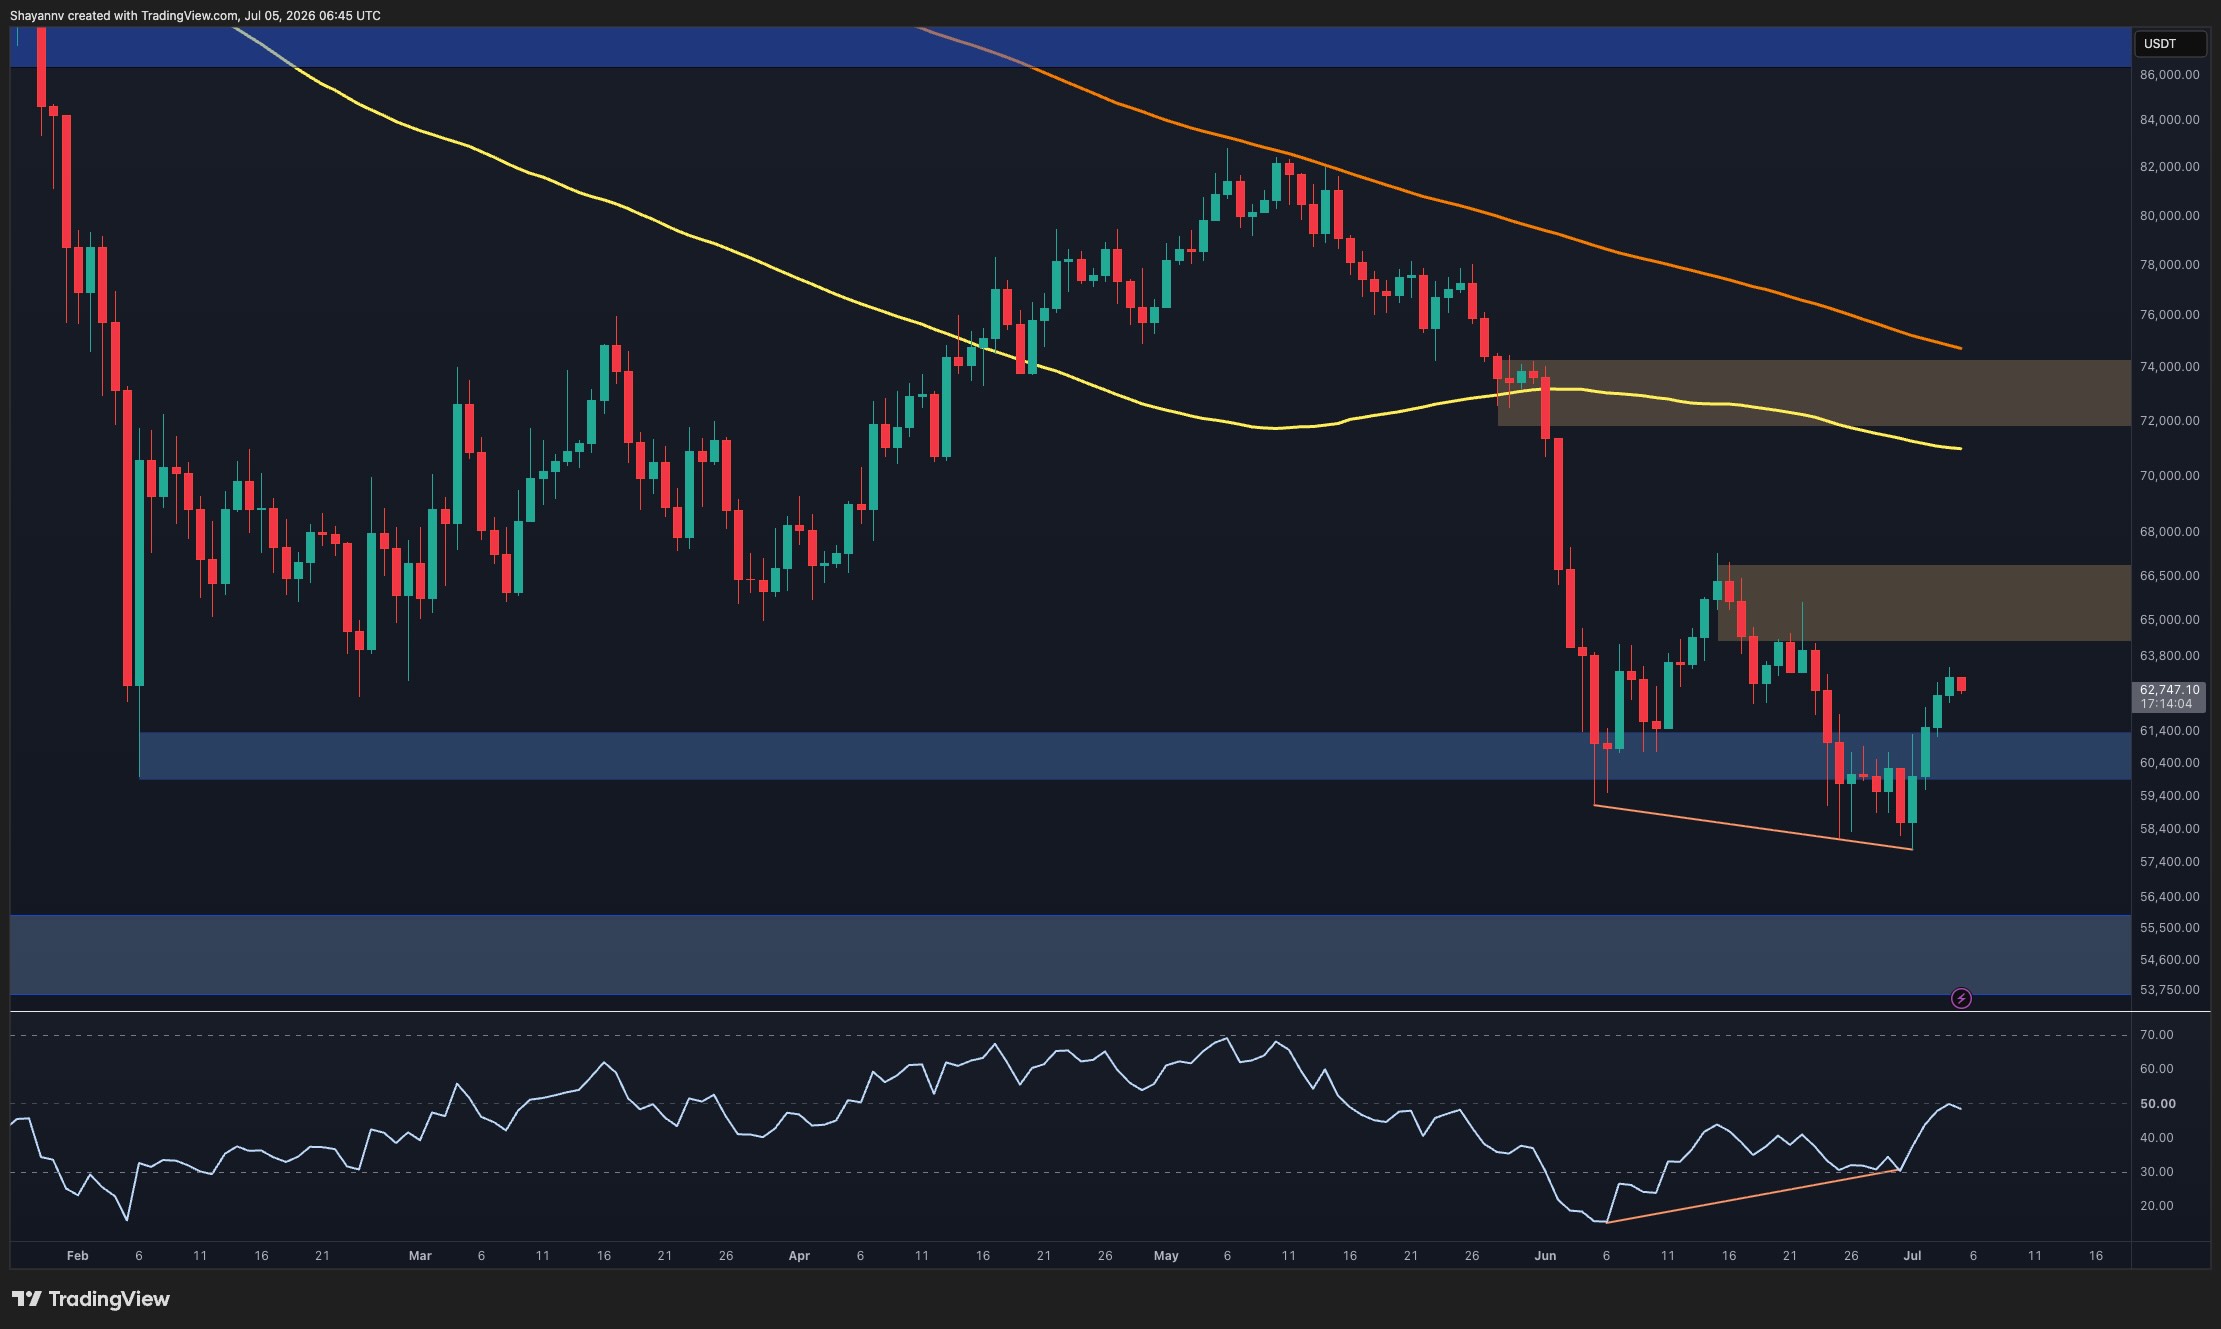
Bitcoin staged a rebound after sweeping liquidity beneath the June lows but now approaches a critical resistance cluster while trading below the downward-sloping 100-day and 200-day moving averages. Having lost the $72K–$74K support zone in June which has flipped into a major supply area, the broader structure remains bearish and BTC must reclaim those resistance levels to materially improve the crypto market outlook.
Predictions Markets
See what traders are focused on

Bitcoin has staged a notable rebound after sweeping liquidity beneath the June lows, but the recovery is now approaching a critical resistance cluster. While momentum has improved in the short term, the broader structure remains bearish until BTC reclaims several major resistance levels overhead.
Bitcoin Price Analysis: The Daily Chart
The daily timeframe shows Bitcoin continuing to trade below its key moving averages, with both the 100-day and 200-day moving averages sloping lower and acting as dynamic resistance. The market remains structurally bearish after losing the $72K-$74K support zone in June, which has now flipped into a major supply area.
In This News
Coins

$ 63.80K
+1.03%
$ 0.0018
Predictions Markets
See what traders are focused on
Share:
In This News
Coins
$ 63.80K
+1.03%$ 0.0018
Predictions Markets
See what traders are focused on
Share:
Read More
Bitcoin Price Analysis: Has BTC Cleared the Danger Zone After $64K Surge?