OFFICIAL TRUMP (TRUMP) on a Downward Slide: Will It Find a Bottom?
Share:

- OFFICIAL TRUMP is trading around the $6 mark.
- TRUMP is currently in a bearish-to-neutral zone.
The crypto market is stuck in the red, without an escape. All the major asset prices witness downward moves with a clear bearish trend, with the broader market sentiment lingering in extreme fear. Bitcoin (BTC), the largest asset, has slipped to $87.2K and the largest altcoin, Ethereum (ETH), trades at $2.9K.
Meanwhile, OFFICIAL TRUMP (TRUMP) posted a modest drop of over 1.65%. Its daily high was noted at around $6.30, and the bears in the market took control, pushing the price down to fall to a low range of $6.14. If the bearish correction continues to gain traction, the price action would see more loss.
According to the CoinMarketCap data, the OFFICIAL TRUMP is trading at around the $6.20 zone at the time of writing. Besides, with the market cap settling at $1.26 billion, the daily trading volume of TRUMP has spiked by over 2%, reaching the $292.19 million mark.
Can the Official TRUMP Avoid Another Drop?
OFFICIAL TRUMP’s technical analysis reports that the Moving Average Convergence Divergence and the signal lines are below the zero line, which shows its bearish phase. The momentum is weak, and unless the MACD starts curving upward, the downtrend may continue.
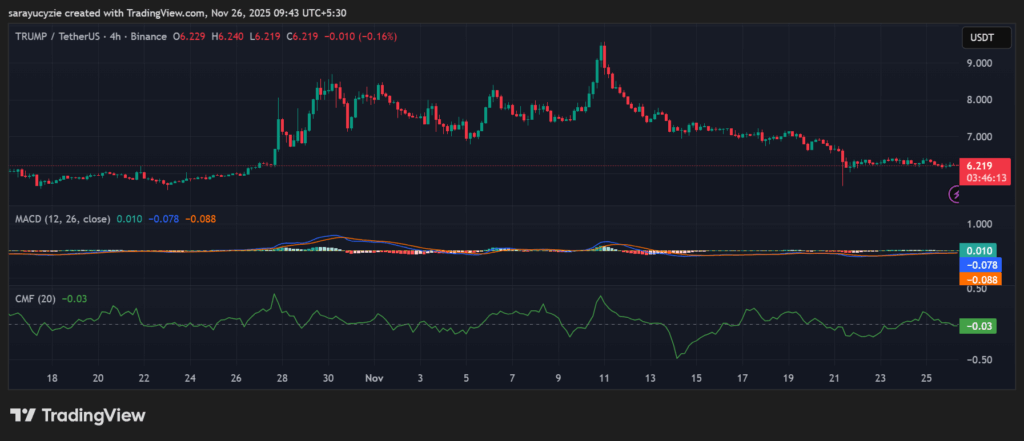
In addition, the Chaikin Money Flow (CMF) indicator of TRUMP at -0.03 hints at a slight selling pressure in the market. The capital is flowing out than in, but the bearish strength is not very strong. If the value drops further, a stronger distribution and seller dominance looms.
The four-hour price chart of OFFICIAL TRUMP might trigger the price to slip toward the $6.14 level. The bears with the potential downside pressure could push for the emergence of the death cross, and gradually send it below $6.08. If the asset reverses the active momentum, the TRUMP price could climb and find the resistance at around $6.26. Further bullish correction might initiate the golden cross to take place, driving the price above the $6.32 range.
Moreover, the daily Relative Strength Index (RSI) found at 38.99 indicates OFFICIAL TRUMP’s bearish to neutral zone, with weak momentum, not yet oversold. The price may approach a region where buyers will soon step in if it moves closer to 30. TRUMP’s Bull Bear Power (BBP) reading of -0.082 suggests that the bears currently have a slight advantage in the market. Also, it gives a mild negative outlook, not a strong downward momentum.
Top Updated Crypto News
Texas Makes Strategic Bitcoin Move with $10M Investment Plan
In This News
Coins


Funds

Share:
In This News
Coins
Funds
Share:
Read More

Record Realized Losses Push Large-cap Altcoins Out of Favor

PI Rises on a Short Bullish Wave: Are Buyers Strong Enough to Sustain the Price?
OFFICIAL TRUMP (TRUMP) on a Downward Slide: Will It Find a Bottom?
Share:
- OFFICIAL TRUMP is trading around the $6 mark.
- TRUMP is currently in a bearish-to-neutral zone.
The crypto market is stuck in the red, without an escape. All the major asset prices witness downward moves with a clear bearish trend, with the broader market sentiment lingering in extreme fear. Bitcoin (BTC), the largest asset, has slipped to $87.2K and the largest altcoin, Ethereum (ETH), trades at $2.9K.
Meanwhile, OFFICIAL TRUMP (TRUMP) posted a modest drop of over 1.65%. Its daily high was noted at around $6.30, and the bears in the market took control, pushing the price down to fall to a low range of $6.14. If the bearish correction continues to gain traction, the price action would see more loss.
According to the CoinMarketCap data, the OFFICIAL TRUMP is trading at around the $6.20 zone at the time of writing. Besides, with the market cap settling at $1.26 billion, the daily trading volume of TRUMP has spiked by over 2%, reaching the $292.19 million mark.
Can the Official TRUMP Avoid Another Drop?
OFFICIAL TRUMP’s technical analysis reports that the Moving Average Convergence Divergence and the signal lines are below the zero line, which shows its bearish phase. The momentum is weak, and unless the MACD starts curving upward, the downtrend may continue.
In addition, the Chaikin Money Flow (CMF) indicator of TRUMP at -0.03 hints at a slight selling pressure in the market. The capital is flowing out than in, but the bearish strength is not very strong. If the value drops further, a stronger distribution and seller dominance looms.
The four-hour price chart of OFFICIAL TRUMP might trigger the price to slip toward the $6.14 level. The bears with the potential downside pressure could push for the emergence of the death cross, and gradually send it below $6.08. If the asset reverses the active momentum, the TRUMP price could climb and find the resistance at around $6.26. Further bullish correction might initiate the golden cross to take place, driving the price above the $6.32 range.
Moreover, the daily Relative Strength Index (RSI) found at 38.99 indicates OFFICIAL TRUMP’s bearish to neutral zone, with weak momentum, not yet oversold. The price may approach a region where buyers will soon step in if it moves closer to 30. TRUMP’s Bull Bear Power (BBP) reading of -0.082 suggests that the bears currently have a slight advantage in the market. Also, it gives a mild negative outlook, not a strong downward momentum.
Top Updated Crypto News
Texas Makes Strategic Bitcoin Move with $10M Investment Plan
In This News
Coins
Funds
Share:
In This News
Coins
Funds
Share:
Read More
Record Realized Losses Push Large-cap Altcoins Out of Favor