HYPE Price Breakout Ignites Rally Talk Toward $170 Target

Share:
Predictions Markets
See what traders are focused on

Whale traders have taken their most aggressive net-long positions in eight months on Hyperliquid’s HYPE token, even as retail participants sit at a 12-month bearish extreme — a gap that data suggests typically resolves in favor of the larger players.
Retail Traders Stand Back As Big Money Moves In
Data from Alphractal shows that since early May, large traders have been quietly building leveraged long positions while retail participants turned bearish and began short selling into the rising trend.
That kind of split has historically triggered a wave of short covering by retail traders, pushing prices higher. HYPE was trading at $62.05 at the time of reporting, with a 24-hour trading volume of $830 million and a market cap of over $15 billion.
The token slipped 2% over the past day, but its technical picture has stayed firmly bullish. Prices are tracking well above the 20-day simple moving average of $47.97 and have broken above the upper Bollinger Band, which analysts say signals strong momentum but also short-term overextension.
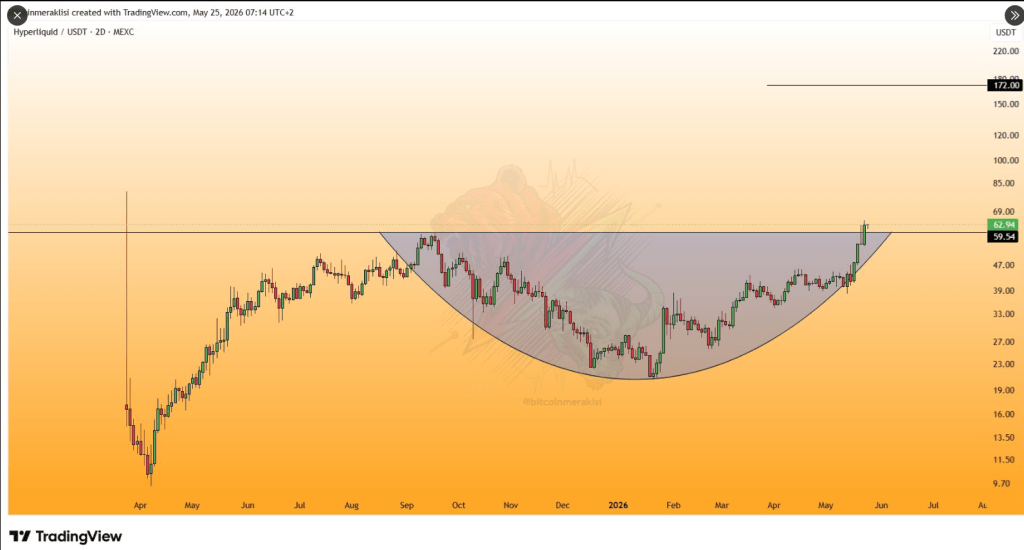
#HYPE Tarihi direnç olan, grafikte belirttiğim Çanak direnci üzeri gün kapanışı yapmayı başardı.
59.54$ direnci üzerinde tutunduğu sürece grafikte belirtiğim çanak hedefi olan 170$ seviyelerini hedefleyecektir.
Grafiği cidden güzel.
Yakın takibinizde olsun. https://t.co/k3F6qaxRh6 pic.twitter.com/DiacAmgSN2
— Bitcoin Meraklısı (@Bitcoinmeraklsi) May 25, 2026
The Line To Watch
Crypto analyst Bitcoin Meraklisi flagged a key development: HYPE closed a daily candle above $59.54, a level that had acted as stubborn resistance for months.
Based on the structure of what analysts describe as a cup formation, that breakout opens a measured technical path toward $170 — a level that would represent roughly a 175% move from current prices.
The $59.54 zone is now viewed as critical support. If the price holds above it, traders say the bullish case stays intact. A failure to hold could put the breakout in doubt.
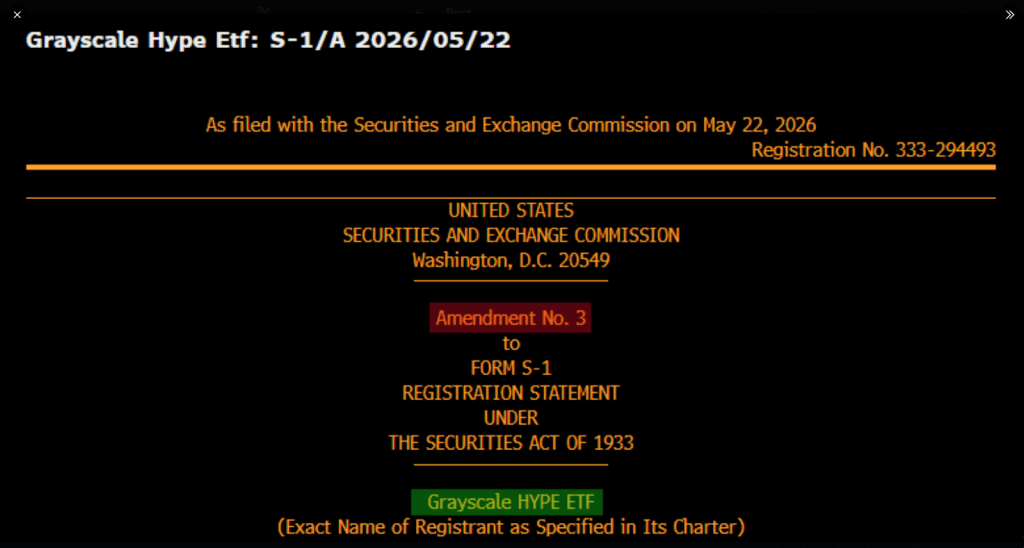
NEW: @Grayscale submits another Hyperliquid ETF filing! This one is amendment #3. Ticker will be $GHYP when it launches. Have to assume we are getting closer to a launch where we’ll have three hyperliquid:native ETFs on U.S. exchanges pic.twitter.com/lvrR3qbxM6
— James Seyffart (@JSeyff) May 22, 2026
The broader rally started taking shape in mid-May, following a period of consolidation through April. Prices have climbed sharply since then, and the MACD indicator has been trending upward in positive territory, with growing green histogram bars backing up the move.
MACD Trend Aligns With Broader Market Push
The Bollinger Bands have widened significantly, pointing to elevated volatility. TradingView data shows the price has risen sharply from lows seen in early February to its current range.
In a separate but related development, Grayscale has filed a third amendment with the SEC related to a potential Hyperliquid ETF, while payments firm MoonPay has launched access to USDH and USDC through the Hypercore network — moves that reflect growing institutional interest around the Hyperliquid ecosystem.
Featured image from Unsplash, chart from TradingView
In This News
Coins

$ 64.35K
+0.78%
$ 0.99983
+0.01%
$ 1.0012
+0.18%

$ 67.98
+1.34%


Predictions Markets
See what traders are focused on
Share:
In This News
Coins
$ 64.35K
+0.78%$ 0.99983
+0.01%$ 1.0012
+0.18%$ 67.98
+1.34%Predictions Markets
See what traders are focused on
Share:
Read More

Audiera defies token unlock dump – Why BEAT surged 18% instead