Bitcoin Price Analysis: BTC Maintains Key Support Levels, Will the Rebound Continue?

Share:
Bitcoin is trading at $80.8k, consolidating just above the $80k psychological level while testing the ascending channel upper trendline and resistance near the converging 200-day moving average around $82k. The 100-day MA has flattened near $72k, a potential mid-term bullish signal, and RSI sits in the 60-65 range after two retracements from overbought, suggesting cautious upside for crypto markets and potential market structure support for price recovery.
Predictions Markets
See what traders are focused on

Bitcoin is trading at $80.8k, consolidating just above the $80k psychologcial threshold that defined the ceiling of this cycle’s correction for months. While the ascending channel’s higher boundary is still holding, the 100-day MA has been left well behind, and the price’s reaction to the current area where the 200-day MA is also converging will likely shape the crypto market trend in the upcoming weeks.
Bitcoin Price Analysis: The Daily Chart
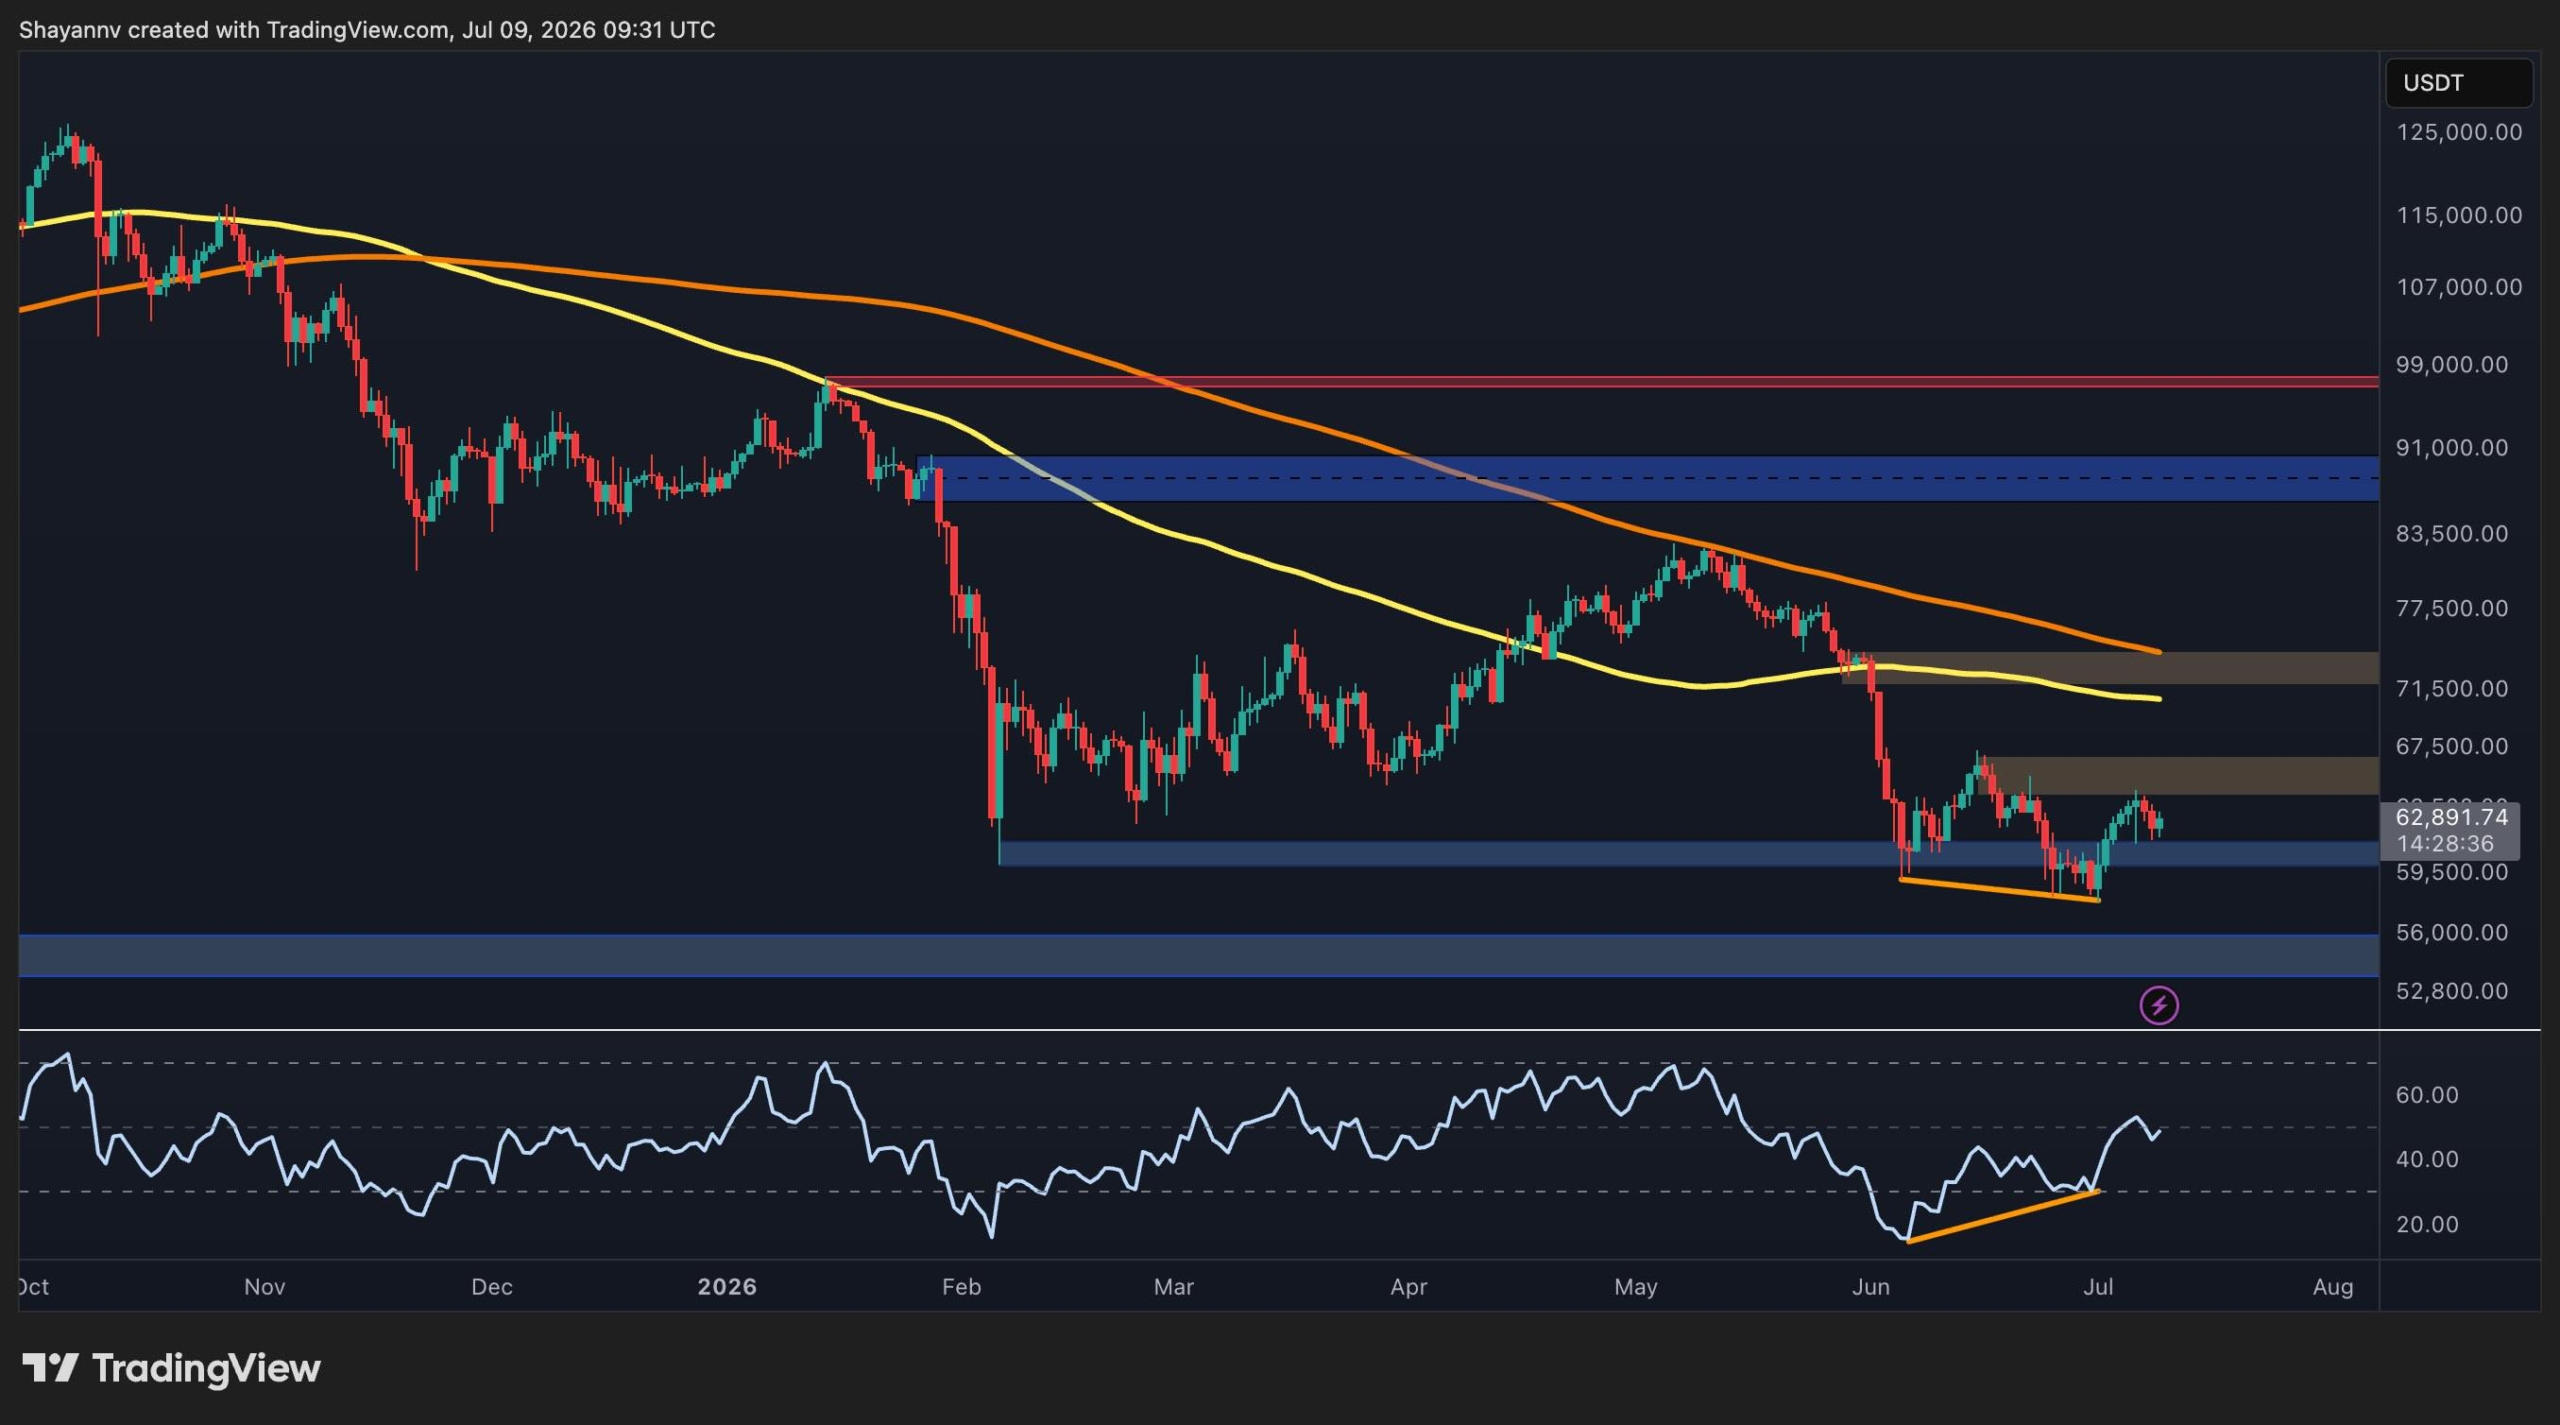
On the daily timeframe, the market is once again testing the ascending channel’s upper trendline, which is also accompanied by the 200-day moving average around the $82k area. Below, the 100-day moving average is now flattening near $72k, which can be a significant signal for a mid-term bullish market structure shift. The asset is currently consolidating just below the channel’s upper boundary and the 200-day MA, while the RSI is holding in the 60–65 range after retracing from nearly overbought levels twice.
In This News
Coins

$ 64.14K
-0.35%
$ 0.00182
+2.43%Predictions Markets
See what traders are focused on
Share:
In This News
Coins
$ 64.14K
-0.35%$ 0.00182
+2.43%Predictions Markets
See what traders are focused on
Share:
Read More
Bitcoin Price Analysis: Has BTC Cleared the Danger Zone After $64K Surge?