Can SHIB attempt recovery towards $0.000007? Check forecast
Share:
Market context: Bitcoin trading below $70,000 and Ether risking a drop under $2,000; Shiba Inu (SHIB) at $0.00000566 after a ~7% rebound earlier this week. On-chain & derivatives signals bullish: SHIB trading volume hit $214.28M (highest since Feb 6), CoinGlass long-to-short ratio 1.36, 4H RSI 56 and MACD bullish crossover; near-term upside targets 50‑day EMA $0.0000063, weekly resistance $0.0000067 and swing high $0.00000724 (token performance, trading volume, on-chain, derivatives, crypto adoption). Risks and caveats: CryptoQuant flags mixed conditions — spot market shows buy-side dominance but signs of overheating and futures sell-side dominance could trigger a pullback toward $0.0000050; monitor liquidity, derivatives exposure and exchange flows (DEX/CEX).
Predictions Markets
See what traders are focused on


The cryptocurrency market has given up some of its earlier gains after underperforming in the last 24 hours.
Bitcoin is trading below $70,000, while Ether risks dropping below the $2,000 psychological level.
Shiba Inu (SHIB), the second-largest memecoin by market cap, is also in the red, down 1% since Tuesday.
It is currently hovering at $0.00000566 as of writing on Wednesday, after posting a nearly 7% rebound over the past two days.
SHIB’s ongoing recovery comes amid bullish on-chain and derivatives data.
The trading volume has also increased, with long positions reaching their highest level in over a month.
On-chain and derivatives data look promising
SHIB added 7% earlier this week but has since pulled back slightly, down less than 1% since Tuesday.
The positive performance earlier this week comes amid strong on-chain and derivatives data.
According to Santiment, the Shiba Inu ecosystem’s trading volume (the aggregate trading volume generated by all exchange applications on the chain) reached $214.28 million on Wednesday, the highest trading volume not seen since February 6.
The surge in trading volume suggests that an increasing number of traders are interested in Shiba Inu.
Furthermore, it signifies growing liquidity in the dog-themed meme coin, boosting its bullish outlook.
The derivatives data also paints a bullish picture. CoinGlass’s long-to-short ratio for SHIB currently stands at $1.36, its highest level in over a month.
The ratio crossing one suggests that more traders are betting on Shiba Inu’s price to rally.
However, summary data from CryptoQuant shows mixed conditions for Shiba Inu (SHIB).
CryptoQuant notes that activity across both spot and futures markets points to a slightly optimistic outlook for the token, supported by large whale orders and buy-side dominance in the spot market.
At the same time, signs of overheating in the spot market, combined with sell-side dominance in the futures market, could prompt some traders to reduce their exposure.
SHIB eyes breakout above $0.000007
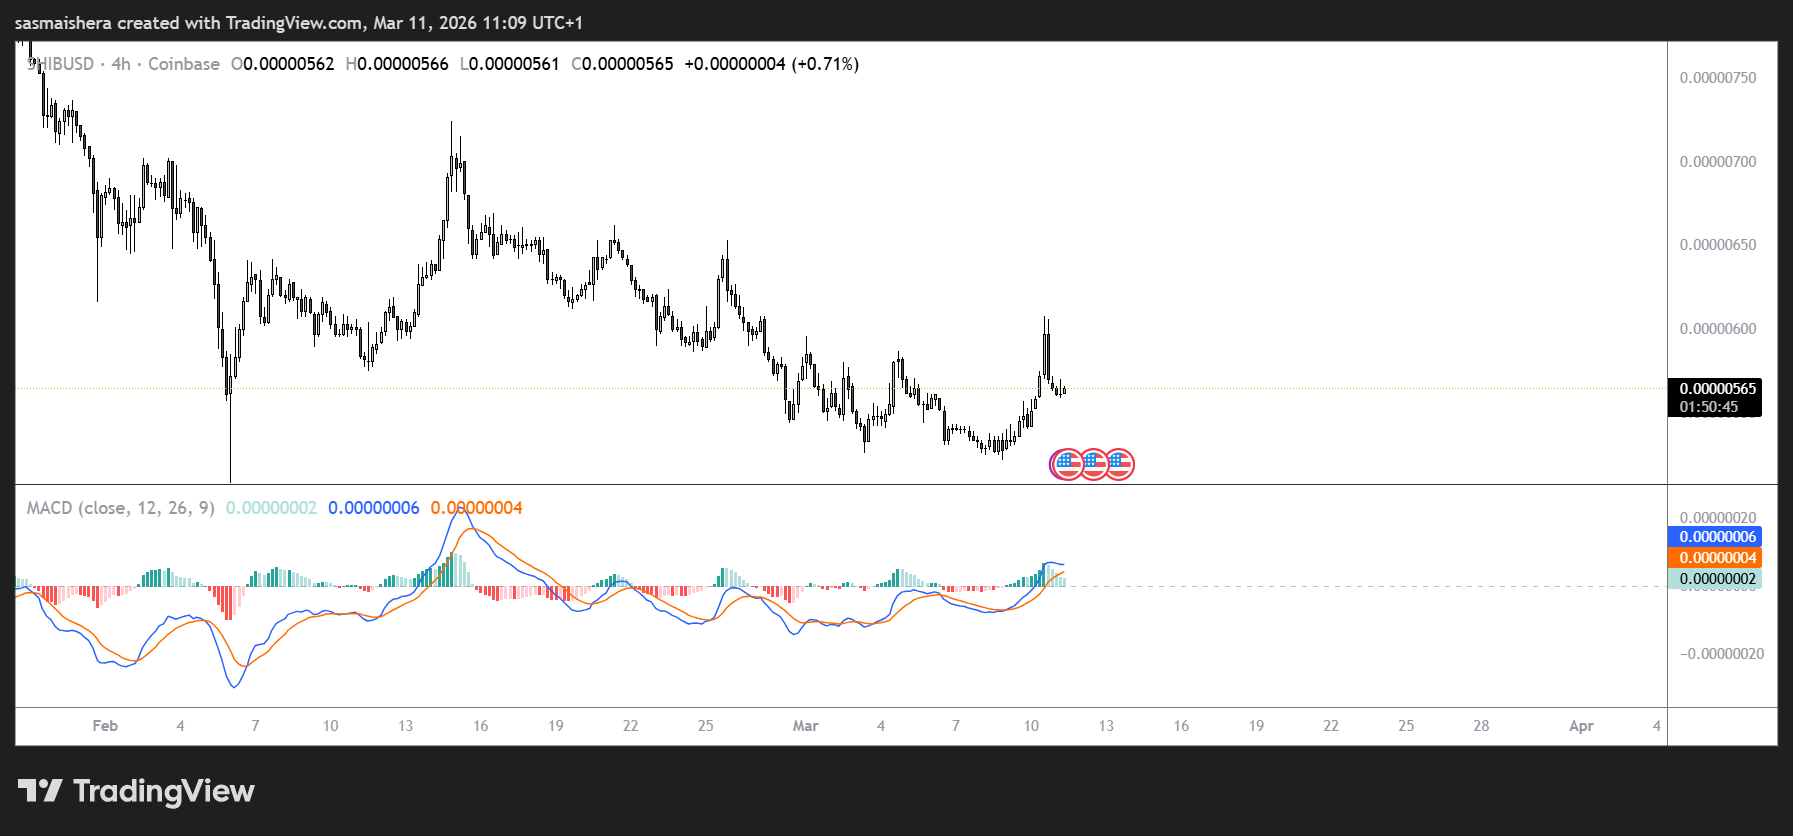
The SHIB/USD 4-hour chart is bearish and efficient after Shiba Inu closed above the daily resistance at $0.0000054 earlier this week.
It maintained its rally on Tuesday, hitting the $0.00000609 mark before retracing to its current level.
If the pullback ends and the recovery continues, SHIB could extend the gains toward the 50-day EMA at $0.0000063.
A close of the daily candle above this level could extend the rally toward the weekly resistance at $0.0000067, with the February 14 swing high of $0.00000724 also a target.
The Relative Strength Index (RSI) on the 4-hour chart is 56, pointing upward toward the overbought region, indicating a growing bullish momentum.
For the recovery rally to be sustained, the RSI must move above the neutral level.
The Moving Average Convergence Divergence (MACD) shows a bullish crossover earlier this week, further supporting the recovery thesis.
If the recovery fails, SHIB could extend its decline and retest the February 6 low of $0.0000050 over the next few hours or days.
The post Can SHIB attempt recovery towards $0.000007? Check forecast appeared first on Invezz
In This News
Coins

$ 64.23K
+0.51%
$ 0.00...441
+0.93%Predictions Markets
See what traders are focused on
Share:
In This News
Coins
$ 64.23K
+0.51%$ 0.00...441
+0.93%Predictions Markets
See what traders are focused on
Share:
Read More

Hackers Are Manipulating the Price of an Altcoin