Spot CVD Chart Analysis: Understanding Order Flow and Volume Heatmap for BTC/USDT
Share:
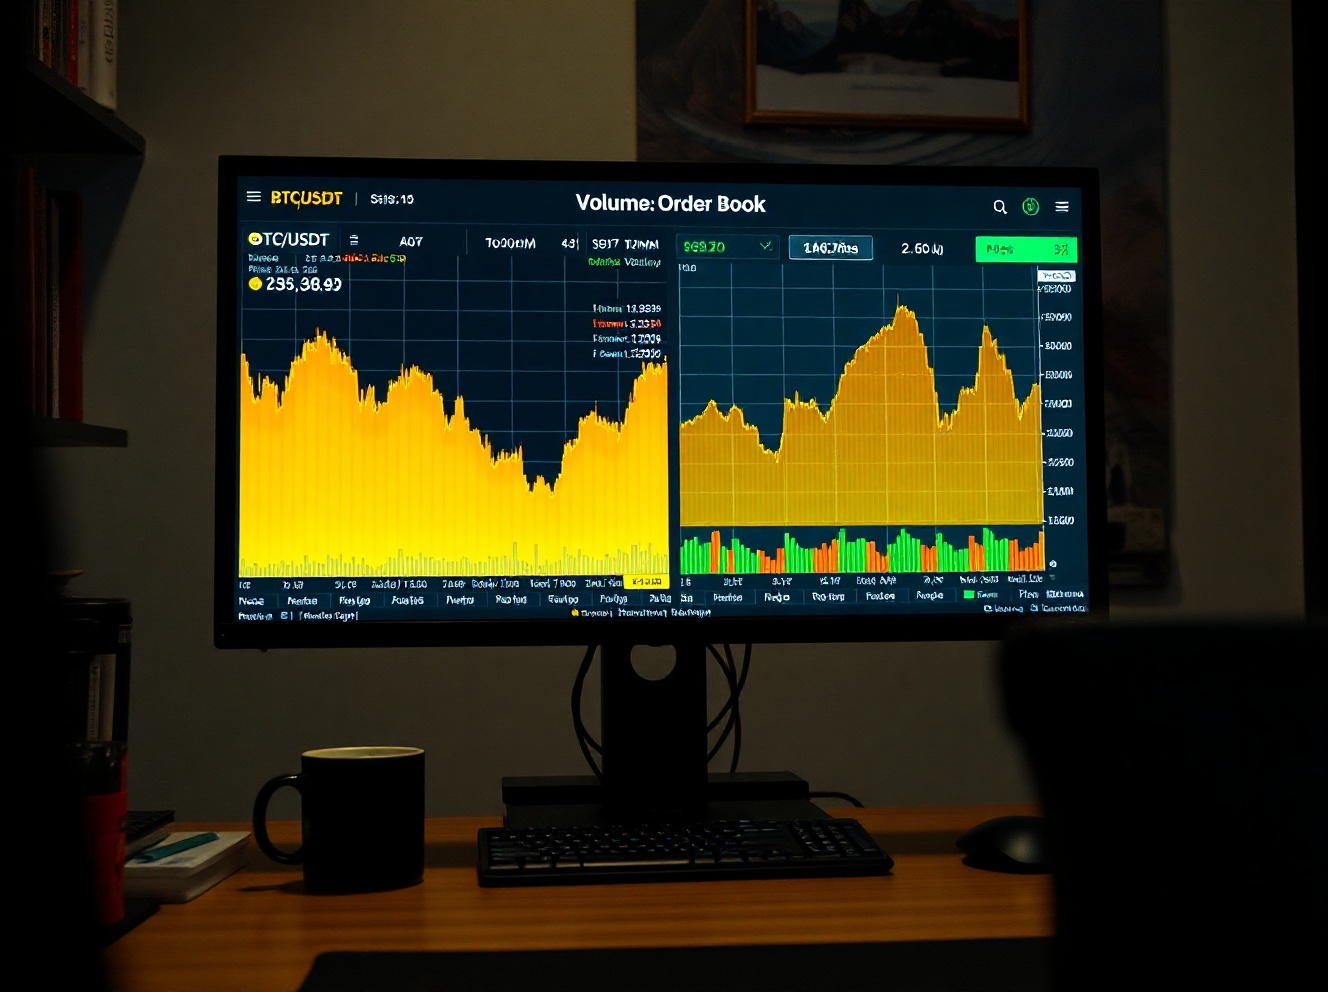
BitcoinWorld outlines a Spot Cumulative Volume Delta (CVD) chart for BTC/USDT, published daily at 10:00 a.m. UTC, that pairs a Volume Heatmap of price-level trading concentration with a CVD split by order size to distinguish retail activity ($100–$1,000) from institutional/whale flows ($1M–$10M). Traders can use bright heatmap zones as potential support or resistance and divergences between the yellow and brown CVD lines to identify order-flow-driven breakouts, but the tool should be used alongside other crypto technical indicators for better risk management.
Predictions Markets
See what traders are focused on

BitcoinWorld
Spot CVD Chart Analysis: Understanding Order Flow and Volume Heatmap for BTC/USDT
For traders analyzing the BTC/USDT spot market, the Spot Cumulative Volume Delta (CVD) chart offers a granular view of order flow dynamics. Published daily at 10:00 a.m. UTC, this chart breaks down buying and selling pressure by order size, helping traders identify potential support and resistance levels.
Understanding the Volume Heatmap
The top panel of the Spot CVD chart features a Volume Heatmap, which tracks trading activity at each price level over time. The heatmap uses color intensity to indicate areas where the price has lingered or moved sharply. Brighter regions on the heatmap suggest higher trading volume concentration, which can act as future support or resistance zones. Traders often watch these levels for potential price reactions.
Cumulative Volume Delta: Buy vs. Sell Orders by Size
The bottom panel displays the Cumulative Volume Delta (CVD), a real-time indicator of net order flow. The CVD line rises when buy orders dominate and falls when sell orders prevail. What makes this chart particularly useful is its breakdown by order size:
- Yellow line: Represents orders between $100 and $1,000. This line reflects retail trader activity.
- Brown line: Represents large orders between $1 million and $10 million. This line indicates institutional or whale activity.
By comparing these two lines, traders can gauge whether smaller or larger market participants are driving price movements. A divergence between the two lines may signal a shift in market sentiment.
Why Order Size Matters
Large orders often have a more significant impact on price due to their size, while smaller orders may indicate broader retail sentiment. When the brown line (large orders) rises sharply while the yellow line remains flat, it may suggest that institutional players are accumulating or distributing positions. Conversely, a surge in the yellow line without corresponding large-order activity might indicate retail-driven momentum that could be less sustainable.
Practical Implications for Traders
The Spot CVD chart is updated daily at 10:00 a.m. UTC, providing a consistent reference point for intraday analysis. Traders can use the Volume Heatmap to identify key price levels where significant trading activity has occurred, while the CVD helps confirm the direction and strength of order flow. This combination can be particularly useful for identifying potential breakouts or reversals.
It is important to note that no single indicator should be used in isolation. The Spot CVD chart is best used alongside other technical analysis tools, such as moving averages, volume profiles, and support/resistance levels, to build a more complete market picture.
Conclusion
The Spot CVD chart provides a detailed look at order flow dynamics for the BTC/USDT trading pair. By combining a Volume Heatmap with a cumulative volume delta broken down by order size, it offers traders insight into both retail and institutional activity. While no tool guarantees market predictions, understanding order flow can help traders make more informed decisions.
FAQs
Q1: What does the yellow line on the Spot CVD chart represent?
The yellow line tracks cumulative volume delta for orders between $100 and $1,000, typically reflecting retail trader activity.
Q2: How often is the Spot CVD chart updated?
The chart is published daily at 10:00 a.m. UTC for the BTC/USDT spot trading pair.
Q3: Can the Volume Heatmap predict future price movements?
The Volume Heatmap highlights areas of high trading activity, which may act as support or resistance, but it should be used in conjunction with other analysis tools for a more reliable assessment.
This post Spot CVD Chart Analysis: Understanding Order Flow and Volume Heatmap for BTC/USDT first appeared on BitcoinWorld.


Read More
BTC Spot CVD Chart: Order Book Heatmap and Volume Delta Analysis (Aug. 17)