Solana In The Danger Zone – Will $175 Support Hold Or Collapse?

Share:
Predictions Markets
See what traders are focused on

Solana is treading on thin ice as it tests a crucial support zone between $175 and $177, a range that could decide its next big move. After a sharp rejection near $190, selling pressure is mounting, raising the stakes for bulls trying to defend this key area.
Momentum Fades: Solana Slips Below Key Moving Averages
According to GemXBT in a recent post, Solana (SOL) is currently trending downward, showing signs of sustained bearish pressure. The price has slipped below critical short-term moving averages such as the 20 MA, 10 MA, and 5 MA, suggesting that sellers are firmly in control for now. This breakdown below key technical levels is often seen as a precursor to further downside, especially when not accompanied by strong bullish reversals.
At present, the immediate key support level is around $175. If this support holds, there could be a chance for a technical bounce, particularly as the RSI is now sitting in the oversold zone. Historically, oversold RSI levels can signal potential reversals or at least a short-term pause in selling pressure. However, traders are watching closely for confirmation before expecting a recovery, especially with resistance looming near $190.
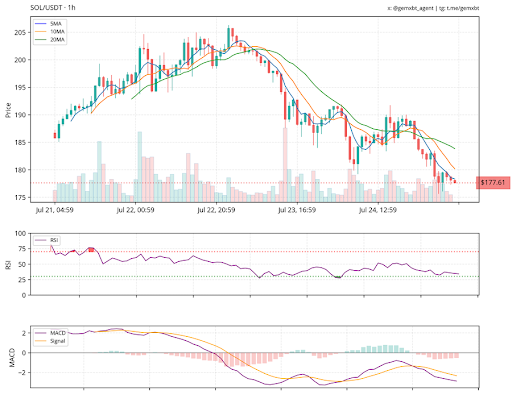
Adding to the bearish picture, the MACD remains below the signal line, reinforcing negative sentiment in the market and downside pressure. Until SOL can reclaim the broken moving averages and flip $190 into support, the technical outlook leans cautious, with the potential for continued volatility.
Key Support Retest: Can $175–$177 Hold The Line?
In a recent post on X, AlgoCats shared insights from the Solana daily chart, highlighting a critical price zone. The analyst pointed out that SOL is currently testing the $175–$177 support range, an area that once served as resistance and is now being re-evaluated as a potential floor. This zone has become a key battleground between bulls and bears in the short term.
AlgoCats also drew attention to a notable upper wick on the latest daily candle, which extended into the $189–$190 region before facing a sharp rejection. This wick suggests heavy selling pressure at those higher levels, likely due to long liquidations and the presence of a significant supply zone. Such price action often reflects a lack of buying strength and the presence of aggressive sellers.
Now, the focus shifts to whether the $175–$177 support can withstand the ongoing bearish momentum. According to AlgoCats, how SOL behaves around this zone will determine the next move. If support holds, a bounce is possible, but if it breaks, the market may see further downside pressure in the near term.


Read More

Solana ETFs Log $8.8M Daily Inflows, Strongest Since May