Bitcoin Has Entered Its ‘Most Dangerous Quarter,’ And This Expert Is Warning Investors

Share:
Bitcoin rebounded above $80,000 (trading ~$81,530) aided by strong ETF inflows in Apr–May; still ~35.5% below its Oct 2025 peak and approaching the 200-day EMA (~$83,000), highlighting crypto market momentum and adoption signals. Crypto Patel warns a repeating mid‑term cycle pattern: May peaks in 2014, 2018 and 2022 preceded collapses of −76.04%, −68.35% and −70.06%; applying that structure projects a ~66.54% drawdown from current levels and a potential bottom between $50,000 and $30,000 (cycle/halving risk, drawdown). Analysts caution the recent relief rally may be a trap after consolidation at $60k–$72k; some expect the bear to extend through Q4 before a durable bottom, underscoring market risk for Bitcoin and broader crypto (ETF, halving, price action).
Predictions Markets
See what traders are focused on

The Bitcoin recovery above $80,000 has brought some sort of confidence back into the crypto market, but a crypto expert is warning that the timing of the rebound may be more dangerous than it looks. As noted by the expert, who goes by the name Crypto Patel on X, Bitcoin has now entered the same part of the four-year cycle that previously produced some of its deepest quarterly breakdowns.
Bitcoin Is Repeating A Mid-Term Year Pattern
Bitcoin has broken above the $80,000 mark and this has led to Coinmarketcap’s fear and greed index pushing into high neutral numbers. This move has been helped by stronger ETF inflows in April and May, but Bitcoin is still 35.5% below its October 2025 peak. All these factors say Bitcoin’s price action in May is starting with a positive note. However, according to observations noted by Crypto Patel on the social media platform X, mid-term years have been accompanied by Bitcoin price crashes, and this has repeated across multiple cycles.
The expert pointed to previous price actions in May in previous years as examples of this mid-term year weakness. His chart, published alongside the post, pointed to four distinct bear markets, each annotated with the peak-to-trough decline.
In 2014, Bitcoin peaked in May and subsequently fell 76.04%. In 2018, another May peak preceded a 68.35% collapse. In 2022, the same seasonal window in May led to a 70.06% price crash. The pattern is precise: three midterm years, three May peaks, and three catastrophic declines. “Three for three,” Crypto Patel wrote. “Not coincidence. Cycle mechanics.”
The chart then projects a similar structure into 2026, which is a mid-term year, showing another possible 66.54% drop from the current price.
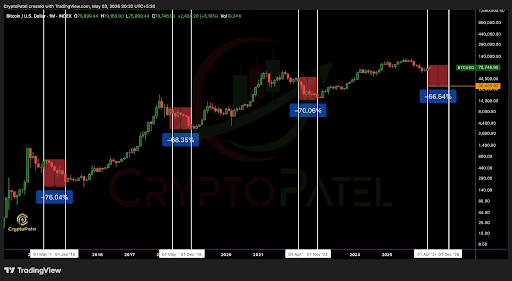
Bitcoin Price Chart. Source: @CryptoPatel On X
The Relief Rally Trap
According to this outlook, the Bitcoin price is now at an identical inflection point, right where previous cycles began their most damaging legs down. Applying the average drawdown structure from prior mid-term cycles to the current price action, Crypto Patel projected a bottom zone anywhere between $50,000 and $30,000.
The difficult part of Patel’s outlook is that Bitcoin’s current market structure is not completely bearish. At the time of writing, Bitcoin is trading at $81,530 and is now close to breaking above its 200-day EMA around $83,000.
Bitcoin spent the last eight weeks consolidating in the $60,000 to $72,000 range before its recent recovery. That recovery has been interpreted by much of the market as confirmation that the bottom is established and the worst is over. However, the crypto expert’s post directly addresses this sentiment as a possible trap. “The dip is in. Wrong. That’s the trap,” he said.
Several analysts have also noted that the four-year halving cycle suggests that the current bear market may extend through Q4 before forming a durable bottom.


Read More

Bitcoin (BTC) Enters a Critical Zone: Will Buyers Fuel a Breakout or Surrender $60K?