Bitcoin Spot CVD Chart at 9:00 AM on Aug. 21: Key Levels to Watch
Share:
On Aug. 21 at 9:00 a.m. UTC the Bitcoin spot CVD for BTC/USDT showed rising retail-sized orders ($100–$1,000) while large institutional bands ($1M–$10M) dipped, signaling divergent order flow and short-term uncertainty. The volume heatmap flagged a dense support cluster at $58,000–$59,000 so holding that zone could sustain buying but a break below may trigger a rapid sell-off; traders should monitor CVD, order flow and liquidity across CEX and DEX for confirmation.
Predictions Markets
See what traders are focused on

BitcoinWorld
Bitcoin Spot CVD Chart at 9:00 AM on Aug. 21: Key Levels to Watch
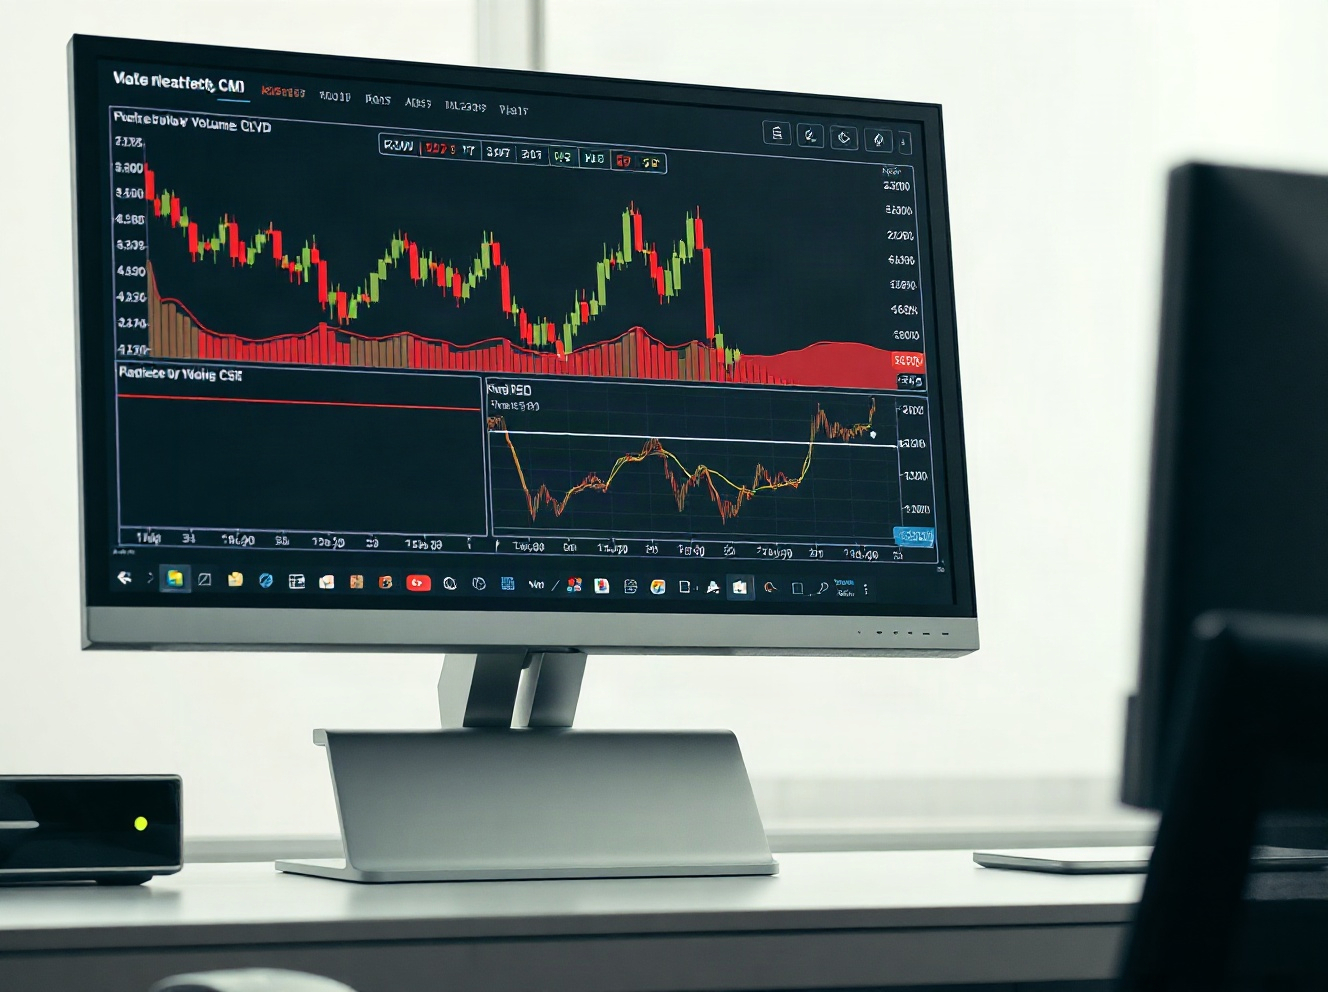
On August 21, at 9:00 a.m. UTC, the Bitcoin spot market showed notable order flow activity in the BTC/USDT trading pair, as reflected in the spot Cumulative Volume Delta (CVD) chart. This chart, which tracks order book activity, offers traders a real-time view of buying and selling pressure, with the upper panel displaying a volume heatmap and the lower panel showing cumulative volume delta.
Understanding the Volume Heatmap and CVD
The volume heatmap in the upper panel visualizes trading volume by price zone. Background colors become brighter when the price lingers in a specific range or makes a significant move, indicating areas where price may find support or resistance. For instance, a bright zone at a previous high could act as resistance, while a bright zone at a prior low might serve as support.
The CVD indicator, on the other hand, reflects buy and sell orders by order size. As buy orders increase, the line for the corresponding size band moves higher. The yellow line represents orders between $100 and $1,000, while the brown line tracks large orders between $1 million and $10 million. These bands help traders gauge whether retail or institutional players are driving the market.
Key Observations from the Aug. 21 Chart
At the time of the chart, the CVD lines showed a mixed picture. The yellow line (retail-sized orders) appeared to be rising steadily, suggesting consistent buying interest from smaller traders. In contrast, the brown line (large orders) showed a slight dip, indicating that some large holders may have been taking profits or reducing exposure. This divergence could signal short-term uncertainty, as retail buying may not be enough to sustain a rally without institutional support.
The volume heatmap also highlighted a dense cluster of trading activity around the $58,000–$59,000 range, which has historically acted as a strong support level. If the price holds above this zone, it could attract further buying; a break below might trigger a quick sell-off.
Why This Matters for Traders
For active traders, the CVD chart provides actionable insights into market sentiment. A rising CVD with increasing volume typically confirms a bullish trend, while a falling CVD suggests bearish pressure. By monitoring these indicators alongside price action, traders can make more informed decisions about entry and exit points.
Moreover, the distinction between retail and large order flows is crucial. Large orders often move the market, so a sudden spike in the brown line could precede a significant price move. Conversely, if large orders are declining, it may indicate that institutional players are stepping back, which could lead to increased volatility.
Conclusion
The Bitcoin spot CVD chart at 9:00 a.m. on Aug. 21 offers a snapshot of current market dynamics, with retail buying pressure contrasting with slight institutional selling. Traders should watch the $58,000–$59,000 support zone and monitor CVD lines for confirmation of trend direction. As always, combining these indicators with other technical tools and fundamental analysis is essential for a well-rounded trading strategy.
FAQs
Q1: What is the spot CVD indicator?
The spot Cumulative Volume Delta (CVD) indicator measures the net difference between buying and selling volume in the spot market, based on order flow data. It helps traders understand whether buyers or sellers are more aggressive at any given time.
Q2: How does the volume heatmap work?
The volume heatmap displays trading volume by price zone, with brighter colors indicating higher activity. These zones often act as support or resistance levels, as they represent areas where significant buying or selling has occurred.
Q3: Why are order size bands important in CVD?
Order size bands (e.g., $100–$1,000 vs. $1M–$10M) help differentiate between retail and institutional trading activity. Large orders can have a bigger impact on price, so tracking them separately provides deeper insight into market sentiment.
This post Bitcoin Spot CVD Chart at 9:00 AM on Aug. 21: Key Levels to Watch first appeared on BitcoinWorld.


Read More
BTC Spot CVD Chart Analysis: Order Flow Signals at Aug. 18, 3:00 p.m. UTC