Bitcoin Price Crash To $57,000: The Bullish Path That Could End In Tears

Share:
Predictions Markets
See what traders are focused on

Bitcoin’s latest recovery above $94,000 raises up the question of whether it is the next leg for the continuation of a bull cycle or the final rally before a deeper reset. However, an interesting technical outlook shared on TradingView by crypto analyst Xanrox suggests the bullish path many traders are watching could ultimately end lower than expected, even if price strength is strong in the near term.
Elliott Wave Setup Leaves Room For One More Push Higher
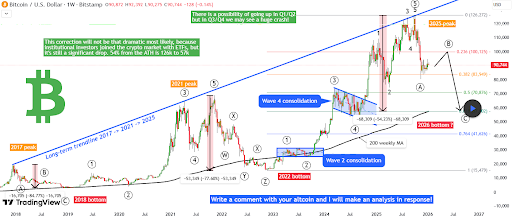
Technical analysis of Bitcoin’s price action on the weekly candlestick timeframe chart shows the cryptocurrency has completed a five-impulse wave that goes as far back as early 2023. This impulse wave count ended with Bitcoin’s peak above $126,000 in October 2025 and the cryptocurrency is now playing out corrective waves ABC.
Based on the Elliott Wave theory, Xanrox noted that Bitcoin may already have completed a sharp decline from a projected 2025 peak near $125,000 down to the low-$80,000 range, labeling that move as a corrective wave A. The price action is now viewed as being in a bullish counter-trend phase, commonly referred to as wave (B) or (X), which is known to retrace a portion of the prior decline before rolling over.
In this scenario, Bitcoin could still advance to as high as the $100,000 to $103,000 range over the coming weeks or months and even encourage a brief rotation into altcoins during the advance. That upside, however, is corrective and not impulsive, and the next move is a larger move lower once the structure is complete.
Bitcoin Weekly Candlestick. Source: TradingView
Long-Term Structure Points To A Painful Reset Window
Xanrox’s analysis places Bitcoin within a long-term linear structure stretching from 2017 into 2026, highlighting how previous market cycles ended with deep corrections after euphoric peaks. The analysis uses the 2018 and 2022 drawdowns, which erased more than three-quarters of Bitcoin’s value each time, as anchors for what could unfold next for the leading cryptocurrency.
According to this framework, the next major corrective phase is projected to play out in 2026, when Bitcoin could fall into the sub-$60,000 region, with $57,000 as the most important area of interest where the correction might end. The $57,000 price correction target is based on the location of the 0.618 Fibonacci retracement when projected from the recent 2025 peak and is going to be just above the 200-week moving average.
The projected move would still represent a correction of roughly 54% from the 2025 high if this actually turns out to be the cycle peak. However, it is important to note that the presence of Spot Bitcoin ETFs introduces a stabilizing force compared to earlier cycles in 2018 and 2022, and so any high correction might find a strong support level before falling as low as $57,000.


Read More

Bitcoin (BTC) Enters a Critical Zone: Will Buyers Fuel a Breakout or Surrender $60K?