Bitcoin Is Trading 40% Beneath Its 200-Day MA — What’s Next?

Share:
Predictions Markets
See what traders are focused on

Recent on-chain data shows that the Bitcoin price is currently at an important phase, raising suspicions as to whether the market is nearing a cyclical bottom.
Mayer Multiple Falls To 0.6 — What This Means
In a recent Quicktake post on the CryptoQuant platform, on-chain analyst Ruga Research pointed out that the Bitcoin price now has a 40% negative deviation from its 200-day moving average. This on-chain observation revolves around the Bitcoin Mayer Multiple.
For context, the Mayer Multiple metric tracks how far a coin’s current price is trading above or below its long-term trend. This indicator is able to achieve this by dividing the price by its 200-day moving average.
When the metric shows a reading of 1, it typically means that the Bitcoin price is trading approximately at the 200-day MA. Meanwhile, readings above 1 reflect that the Bitcoin price is at a premium relative to its long-term trend, while readings below 1 suggest that the price is trading at a discount.
Historically, the metric has several thresholds in tandem with market conditions. For example, when the metric reaches levels above 2.4, it often signals that the Bitcoin price is at an overbought zone (also known as the bubble territory).
As explained earlier, 1 – 1.5 represents the normal bull-market range, while 0.8 – 1.0 is typically the discount zone (where accumulation often occurs). Notably, when the price falls to regions below 0.8, it signals that the Bitcoin price has been oversold, as a result of capitulation events.

Ruga Research revealed that the metric is currently at 0.6, reflecting an approximate 40% deviation below Bitcoin’s long-term trend. Hence, it is apparent that the Bitcoin price stands at a statistical extreme.
Historical data where the Mayer Multiple fell to similar levels also adds credibility to this level’s relevance. In December 2018, the metric dropped to the 0.5 – 0.6 range (near Bitcoin’s market bottom around $3,200) before the price witnessed a more than 540% growth.
Similarly, the metric fell to 0.5 owing to the COVID crash, followed by a recovery and expansion of the Bitcoin price by 1,100% in another 12-month period. This scenario also repeated in November 2022, with the Mayer Multiple falling to the same region, after which the BTC price soared by over 170%.
However, Ruga Research mentioned, as a caveat, that the metric does not precisely spot where and when a bottom will form, but merely reveals what to expect in the long-term. It is also possible that the metric could record further downside moves or see some consolidation before going to the upside.
Bitcoin Price At A Glance
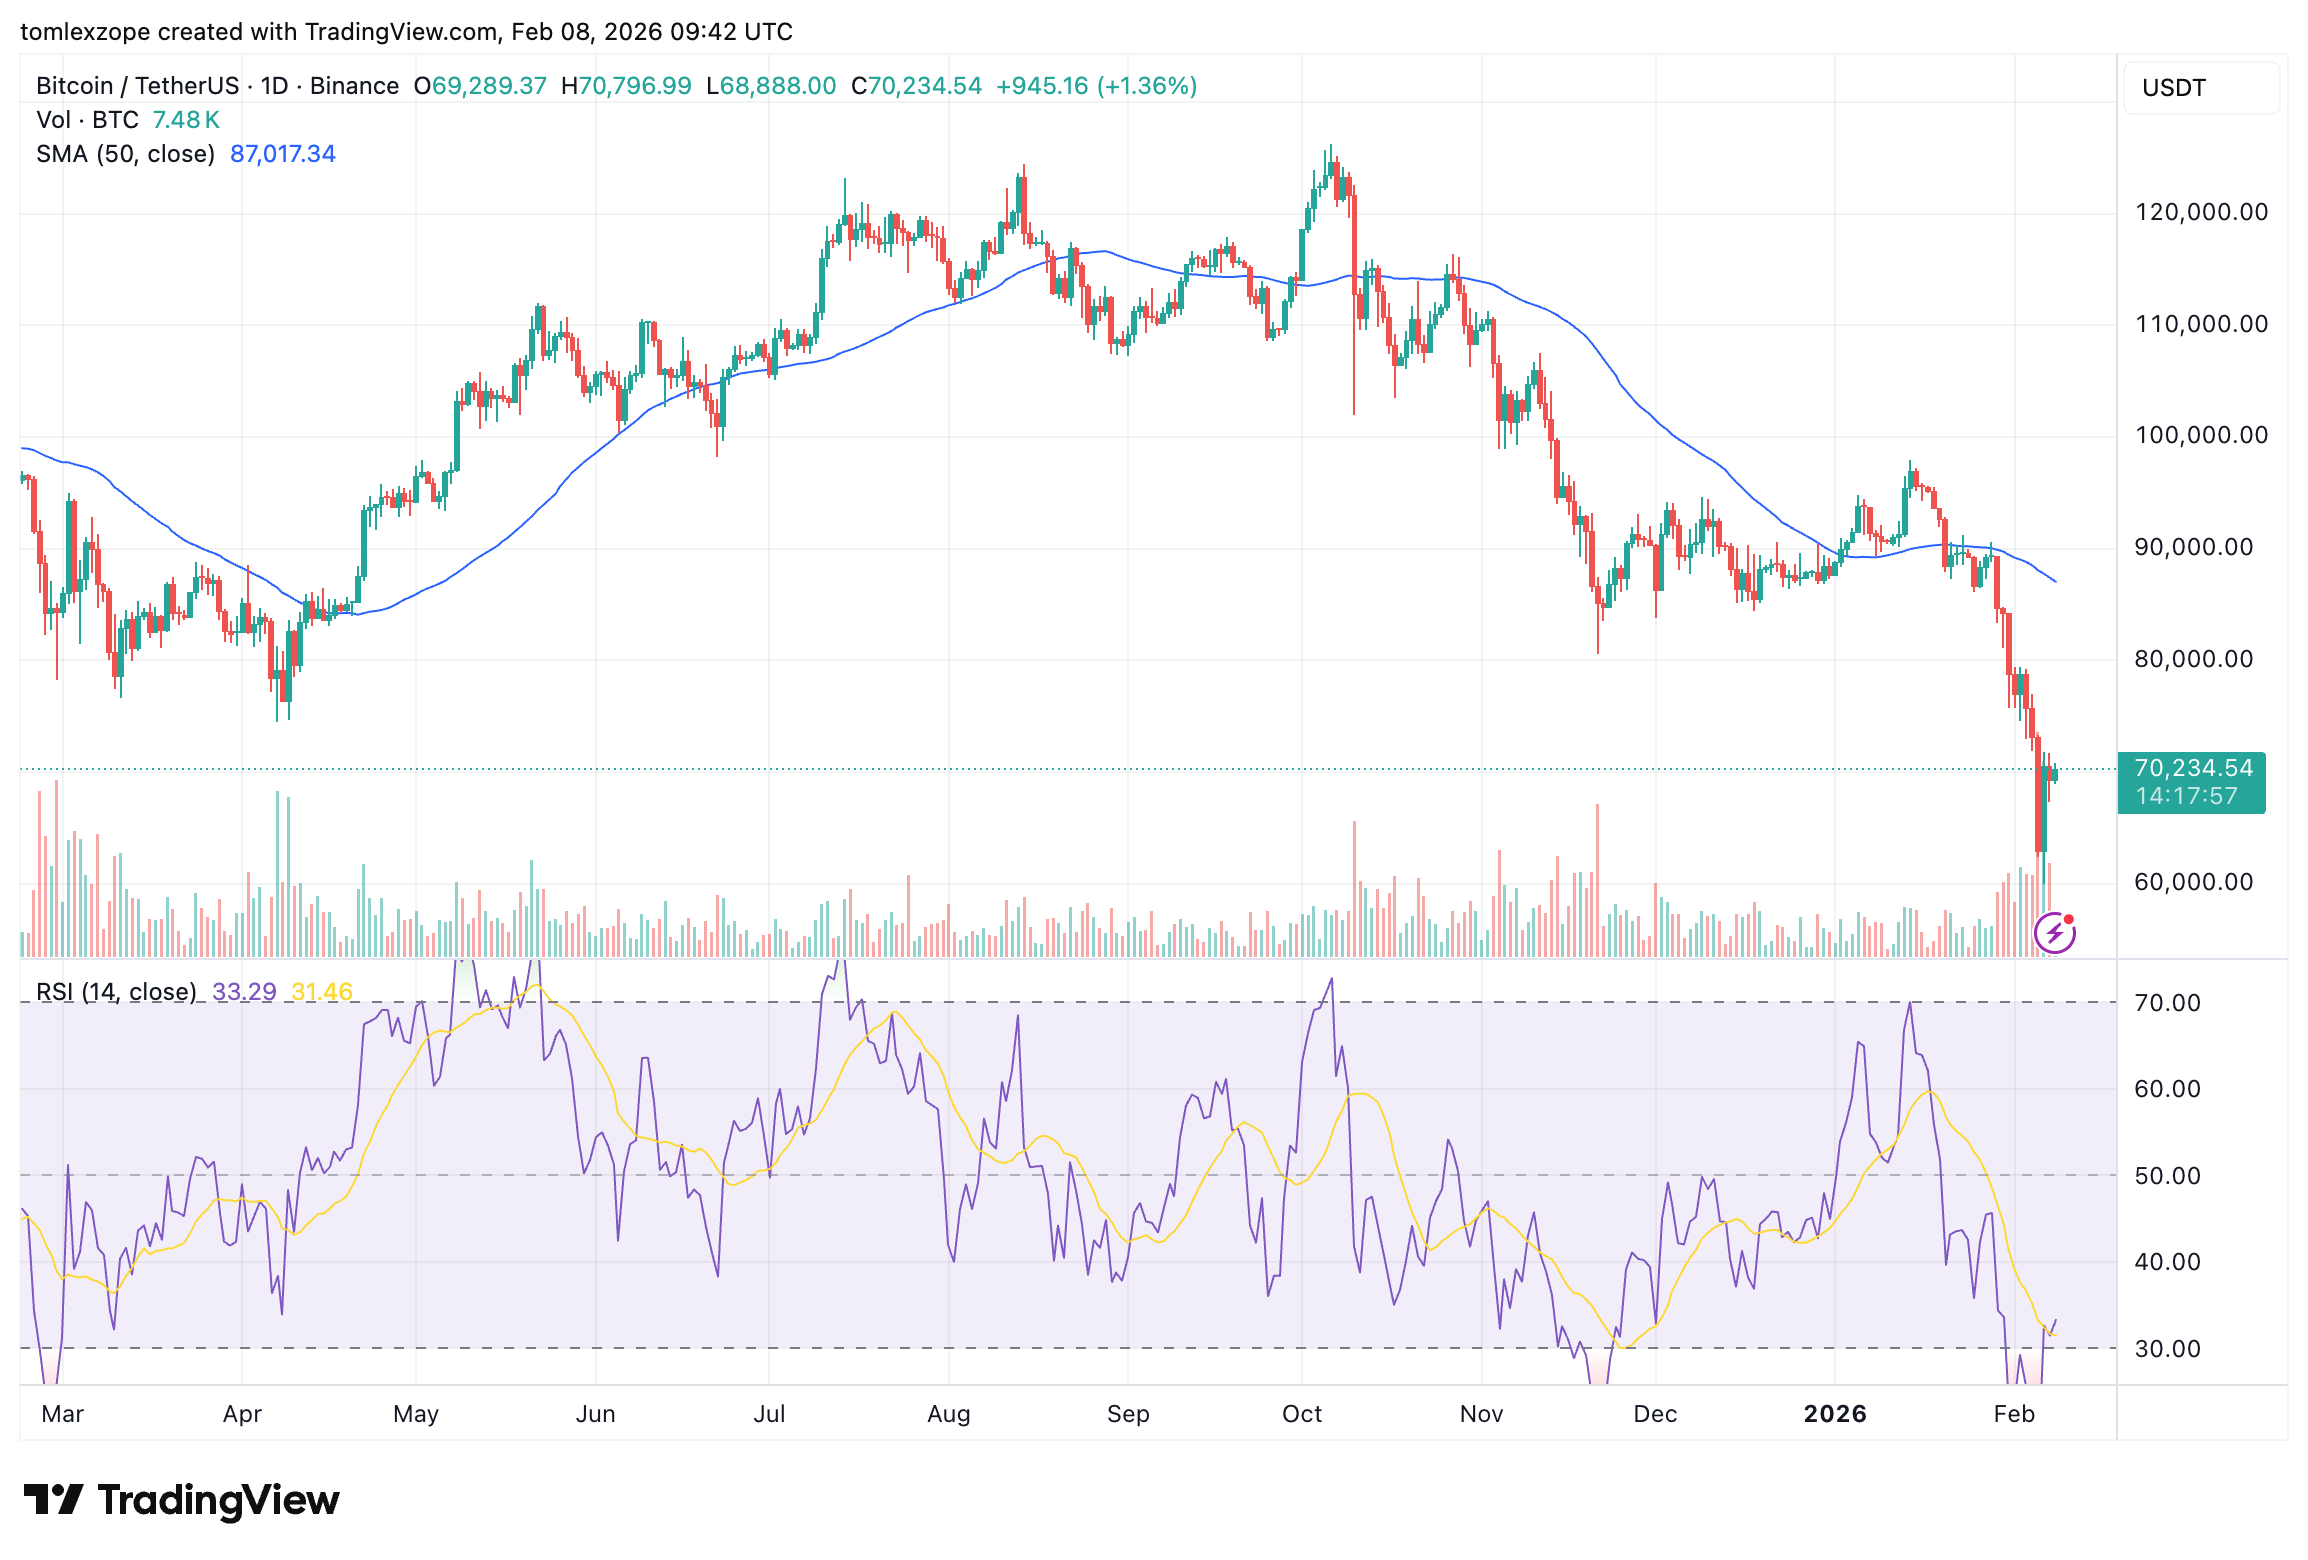
As of this writing, Bitcoin is worth approximately $70,383, reflecting an over 2% jump in the past 24 hours.
In This News
Coins

$ 64.27K
+0.63%
$ 0.00185
+2.73%Predictions Markets
See what traders are focused on
Share:
In This News
Coins
$ 64.27K
+0.63%$ 0.00185
+2.73%Predictions Markets
See what traders are focused on
Share:
Read More

Bitcoin (BTC) Enters a Critical Zone: Will Buyers Fuel a Breakout or Surrender $60K?