Bitcoin Price Breaks 31-Month Pattern: Is BTC Ready to Rally?

Share:
Bitcoin is trading above $64,000 and is showing early signs of a rally as long-term holders now control nearly 16 million BTC, the highest on record, after accumulation that has slowed during an extended 31-month cycle. U.S. spot Bitcoin ETFs recorded $211.49 million in net inflows on August 4 with BlackRock's IBIT holding $51.579 billion, and a $27.36 million short squeeze alongside a rising Binance whale inflow ratio of 0.52 highlight both bullish funding and potential CEX whale sell-pressure risks. Technically BTC remains rangebound between $62,000 and $65,000 with $64,000 the decisive short-term level, making this a key moment for crypto traders watching ETF-driven adoption and market dynamics.
Predictions Markets
See what traders are focused on

Bitcoin price which has been moving sideways since june now is showing early signs of a bull market rally. While Bitcoin is trading above $64,000 as new CryptoQuant data reveals a major shift in long-term holder activity.
At the same time, rising ETF inflows and a $27.36 million short squeeze are giving analysts reasons to believe a new Bitcoin rally could be taking place.
Bitcoin Cycle Is Breaking From History
According to CryptoQuant, Bitcoin’s long-term holders (LTHs) are once again showing a pattern that has appeared before previous market rallies.
The last bull cycle began in January 2023 and continued until December 2025, during which these investors gradually sold part of their Bitcoin as prices climbed. After the market correction, however, they bought back even more BTC than they had previously sold.
As a result, long term now control nearly 16 million BTC, the highest level on record. CryptoQuant says their accumulation has started to slow, with supply beginning to decline again.
Also Read : Bitcoin (BTC) Price Prediction 2026
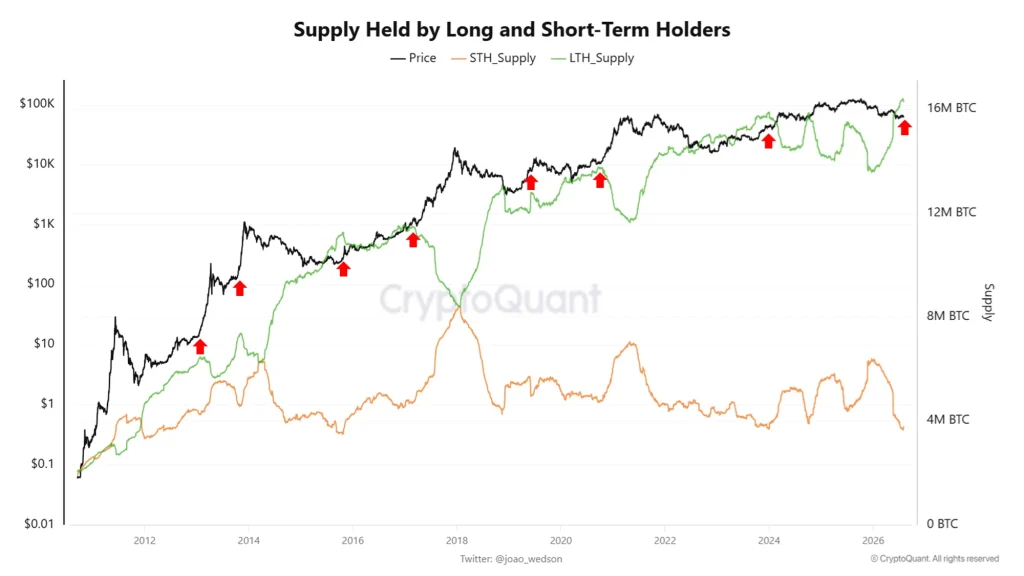
However, this cycle has taken much longer than before.
- 2013 cycle: Second rally began after eight months
- 2017 cycle: Gap lasted 17 months
- 2021 cycle: Around 16 months
This time, it has stretched to 31 months, a delay analysts largely attribute to the launch of U.S. spot Bitcoin ETFs and continued buying from institutional investors and new whales.
ETF Demand Continues to Support Bitcoin
Institutional demand also remains strong. According to Farside, U.S. spot Bitcoin ETFs recorded $211.49 million in net inflows on August 4, with BlackRock’s iShares Bitcoin Trust (IBIT) leading the gains.
The fund now holds $51.579 billion worth of Bitcoin, showing continued interest from large investors.
ETF Demand Faces Off Against Whale Activity
While ETF demand has returned, another on chain indicator suggests traders should continue watching large investors closely.
CryptoQuant analyst Darkfost noted that Binance’s whale inflow ratio has climbed to 0.52, its highest reading in the past four months.
The metric tracks how much of Binance’s Bitcoin inflows come from large holders. A rising ratio generally means whales are sending more BTC to the exchange, increasing the potential for selling pressure.
However, history shows these spikes do not always signal a market top. Similar readings have appeared during both major corrections and important market bottoms, making the indicator more of a caution signal than a bearish confirmation.
Key Level To Watch Out For $64K
From a technical perspective, Bitcoin continues to trade inside the $62,000-$65,000 range that has contained prices for weeks.
Crypto trader The Martini Guy said Bitcoin is once again testing the $64,000 zone, an area that has repeatedly decided the market’s short-term trend.
According to him, holding above this level could give buyers another opportunity to push prices higher. However, losing this support may allow sellers to regain control and trigger another pullback.


Read More
Will Bitcoin Price Hit $100K If Trump Ends The Iran War?