XRP Price Prediction: Is $1 Back in Play as XRP Breaks Down and ETFs Turn Negative?
Share:
XRP broke below triangle support on August 6, slipping 1.29% to $1.0476 with the Bollinger Band at $1.0362 the last technical buffer before the $1 floor, signaling renewed downside risk for the token. Spot XRP ETFs logged a $3.58M outflow on August 5 with Bitwise absorbing the full loss, while Evernorth’s CBO urged focus on XRP’s utility and adoption rather than its trading price.
Predictions Markets
See what traders are focused on

- XRP fell 1.29% to $1.0476 on August 6, breaking below triangle support with the Bollinger Band at $1.0362 as the last floor before $1
- Spot XRP ETFs logged a $3.58M outflow on August 5, the first negative session since July 8, with Bitwise absorbing the full loss
- Evernorth’s Chief Business Officer argued XRP should be judged by what it enables, not what it trades at
XRP breaks below its triangle support on August 6, dropping 1.29% to $1.0476 with only the Bollinger Band lower boundary at $1.0362 standing between current price and the $1 floor.
XRP Breaks the Triangle With the Bollinger Band as the Last Line
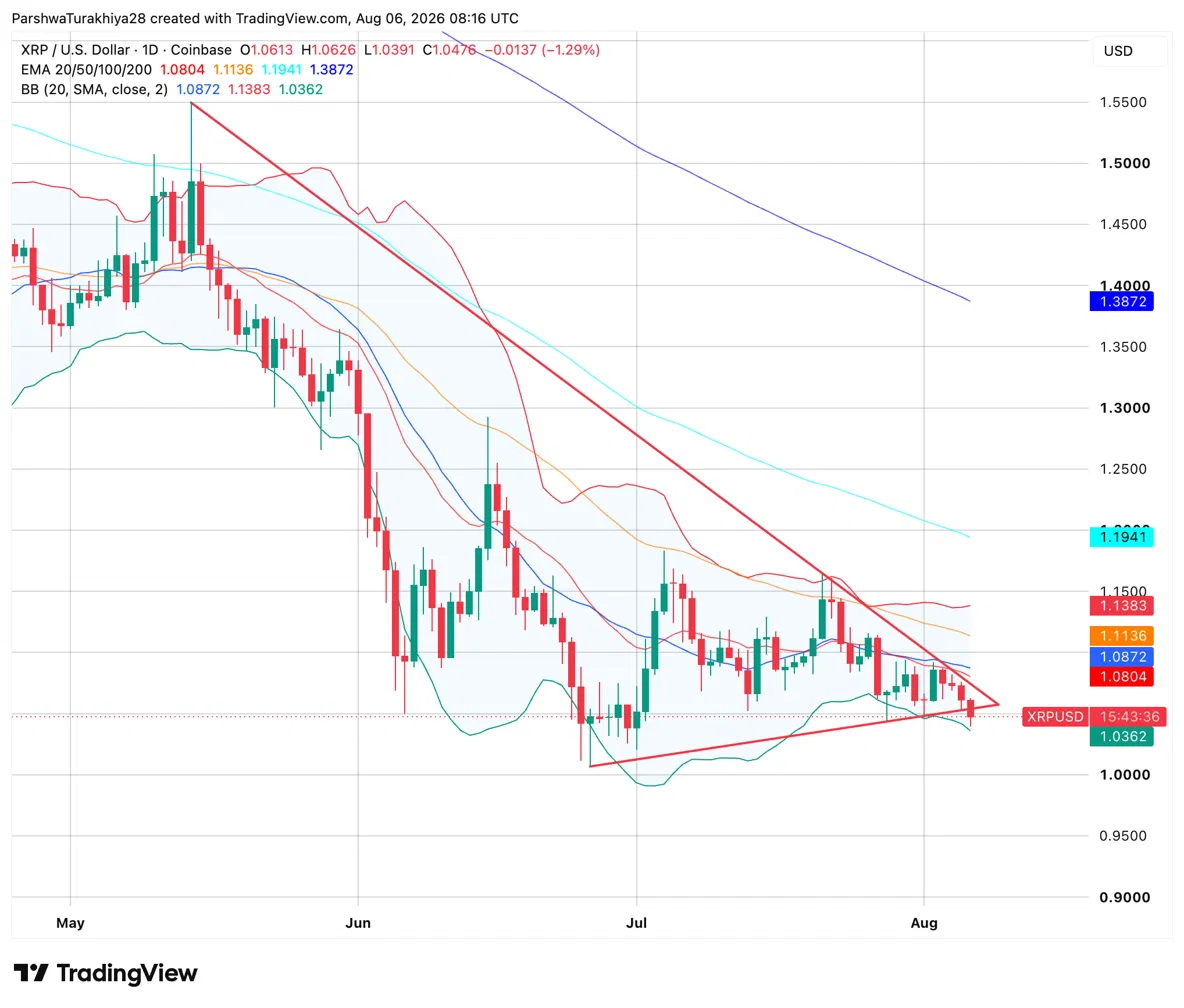
The daily chart shows XRP breaking below the lower trendline of a triangle pattern that has been forming since the May highs above $1.50. Both trendlines slope downward and have been converging for months, with the l…
Read The Full Article XRP Price Prediction: Is $1 Back in Play as XRP Breaks Down and ETFs Turn Negative? On Coin Edition.


Predictions Markets
See what traders are focused on
Share:
Predictions Markets
See what traders are focused on
Share:
Read More

PI Price Prediction: Can Pi Network Sustain Its Rally as 127.5M PI Unlock Approach?