PlanB: Bitcoin Has Already Bottomed, Here’s Why

Share:
PlanB argues Bitcoin has likely bottomed, noting BTC trades around $65,000 near the 200-week moving average (~$65k), a five-month short-term holder realized price of $72,000, 72% of supply in profit (up from 50%), and a monthly RSI rising to 51 from 41. He credits U.S. spot Bitcoin ETFs and the upcoming halving for momentum but warns macro headwinds, regulatory uncertainty and limits of the stock-to-flow model mean the recovery is cautiously optimistic for crypto adoption and price.
Predictions Markets
See what traders are focused on

BitcoinWorld
PlanB: Bitcoin Has Already Bottomed, Here’s Why
Prominent Bitcoin analyst PlanB, known for his stock-to-flow pricing model, has stated that Bitcoin has already passed its cyclical bottom. In a recent post on X (formerly Twitter), PlanB outlined several on-chain and technical indicators that he believes confirm the market has turned a corner. His comments come as Bitcoin trades around $65,000, having recovered significantly from its 2022 lows.
Key Indicators Point to a Bottom
PlanB highlighted three main metrics supporting his view. First, Bitcoin is trading above its 200-week moving average, currently at $65,000, which has historically marked major bear market bottoms. Second, the five-month short-term holder realized price—the average cost basis of coins moved in the last five months—stands at $72,000, and Bitcoin is above that level, indicating that recent buyers are in profit. Third, the share of Bitcoin supply in profit has risen to 72%, up from 50% earlier this year, suggesting that most holders are now underwater no longer. Additionally, Bitcoin’s monthly relative strength index (RSI) has climbed to 51 from 41, moving out of oversold territory.
Context and Market Implications
PlanB’s analysis aligns with a broader recovery in crypto markets, driven by factors such as the launch of spot Bitcoin ETFs in the U.S., which have attracted institutional inflows, and the anticipation of the next Bitcoin halving, historically a catalyst for price increases. However, not all analysts are as optimistic. Some caution that macroeconomic headwinds, including high interest rates and regulatory uncertainty, could still pressure prices. The 200-week moving average has been a reliable support level in past cycles, but it is not a guarantee. The short-term holder realized price is also a dynamic metric that can change quickly if prices fall.
Why This Matters to Investors
For investors, the debate over whether Bitcoin has bottomed is crucial for timing entries. If PlanB is correct, current levels may offer a favorable risk-reward for long-term accumulation. Conversely, if the bottom is not in, further downside could be ahead. The indicators he cites are widely followed, but they are backward-looking and can lag price action. It is also worth noting that PlanB’s stock-to-flow model has been criticized for its predictive accuracy, so his views should be taken as one perspective among many.
Conclusion
PlanB’s assertion that Bitcoin has already bottomed is based on a set of technical and on-chain signals that have historically marked major lows. While the evidence is compelling, the market remains uncertain, and investors should consider a range of factors before making decisions. As always, Bitcoin’s volatility demands caution, but the current data offers a cautiously optimistic outlook.
FAQs
Q1: What is the 200-week moving average and why is it important?
The 200-week moving average is a long-term trend indicator calculated by averaging Bitcoin’s price over the past 200 weeks. It has historically acted as a strong support level during bear markets, and trading above it is often seen as a bullish signal.
Q2: What is the short-term holder realized price?
The short-term holder realized price is the average cost basis of Bitcoin that has been moved within the last five months. When the market price is above this level, short-term holders are generally in profit, which can reduce selling pressure.
Q3: What is the relative strength index (RSI)?
The RSI is a momentum oscillator that measures the speed and change of price movements. A reading above 50 indicates bullish momentum, while below 50 suggests bearish momentum. PlanB noted the monthly RSI rose from 41 to 51, indicating improving momentum.
This post PlanB: Bitcoin Has Already Bottomed, Here’s Why first appeared on BitcoinWorld.


Read More
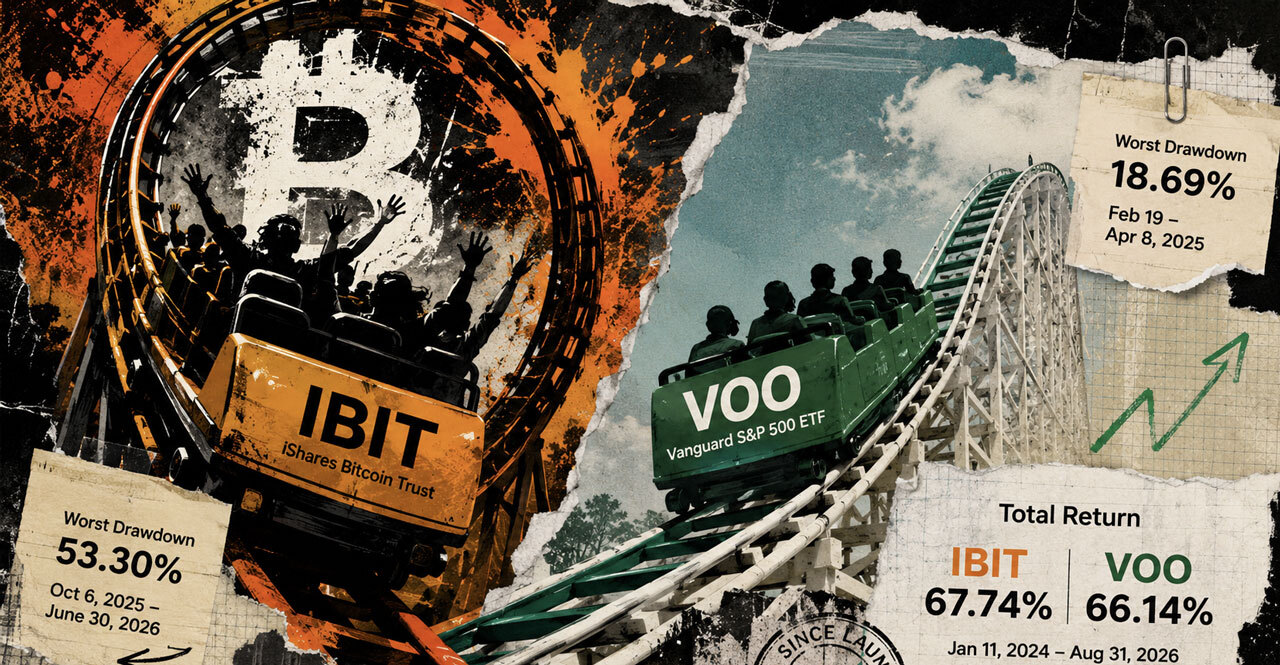
BlackRock’s Bitcoin ETF barely beat the S&P 500 after putting investors through a 53% crash