Blockchain Report of February 2024: Dominance, Development, and Adoption Insights
Share:
Predictions Markets
See what traders are focused on

The post Blockchain Report of February 2024: Dominance, Development, and Adoption Insights appeared first on Coinpedia Fintech News
The blockchain sector is booming and no longer just a futuristic tech concept – it is today’s technology. For tech enthusiasts to thrive in this fast-paced, competitive world, a clear understanding about each and every development of the industry is crucial.
This monthly report simplifies blockchain analysis, offering a clear overview of the sector’s latest developments. Using high-quality data ensures utmost clarity in this exploration. Let’s dive into the report to stay updated on the rapidly transforming blockchain landscape, and to remain informed about all the major trends, which the data collected for the month recognises.
1. Blockchain Performance: A General Analysis
A primary analysis of the performance of a blockchain for a particular month can be done using Total Value Locked.
Total Value Locked in a blockchain’s decentralised finance ecosystem reflects the aggregate value of assets locked in smart contracts. A rising TVL indicates adoption, economic activity, and user trust, suggesting a positive month of robust DeFi participation, enhancing the overall performance of the blockchain.
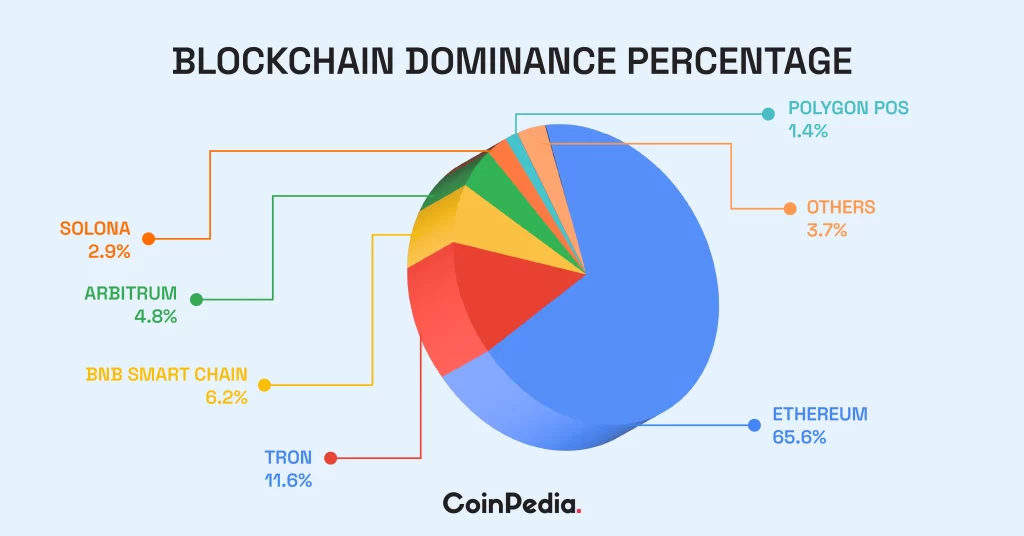
1.1. Blockchain Performance Analysis Using TVL and Dominance
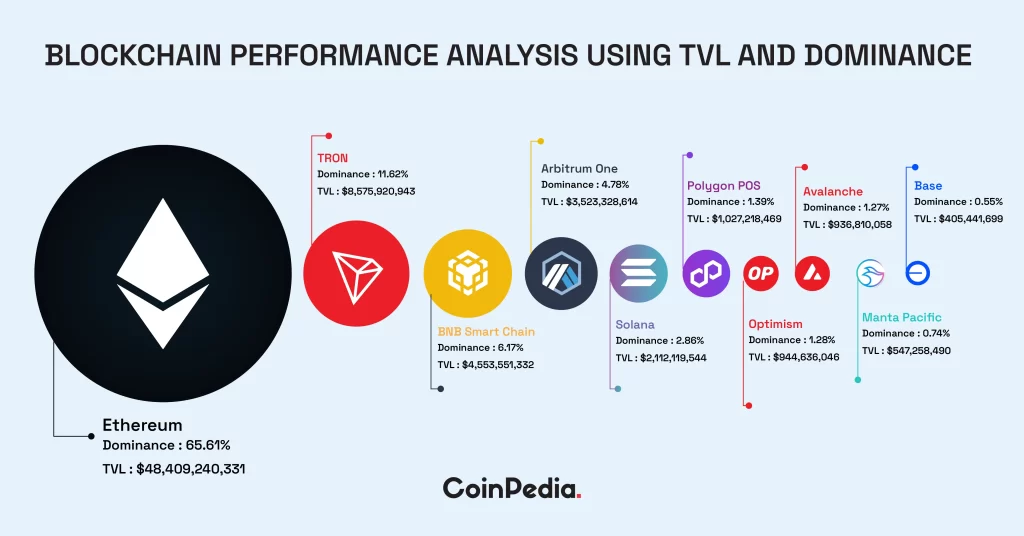
Ethereum dominates with 65.61%, and Tron and BSC closely follow with 11.62%, 6.17%.
1.1.1. Analysing Top Blockchains Using 30-Day TVL Movement
Let’s re-analyse the top blockchains, which dominates the blockchain sector in terms of the YTD TVL data, with the 30-Day TVL movement data, to know how much movement the top chains have witnessed in the last 30 days.
| No. | Blockchain | 30-Day TVL Movement (in %) |
| 1 | Ethereum | 43.8% |
| 2 | TRON | Nil |
| 3 | BNB Smart Chain | 23.4% |
| 4 | Arbitrum One | 22.0% |
| 5 | Solana | 53.1% |
| 6 | Polygon POS | 18.4% |
| 7 | Optimism | 7.9% |
| 8 | Avalanche | 15.2% |
| 9 | Manta Pacific | 24.4% |
| 10 | Base | 5.0% |
Solana dominates with 53.1%. Ethereum follows closely with 43.8%.
1.2. Blockchain Monthly Performance Analysis Using 30-Day TVL Movement
Let’s see how things will appear when we do the performance analysis solely based on the 30-day TVL movement data.
| Blockchain | 30-Day Movement (in %) |
| Sei Network | 116.6% |
| StarkNet | 85.4% |
| Aptos | 60.5% |
| Hedera Hashgraph | 59.6% |
| Mantle | 56.8% |
| Solana | 53.1% |
| Ethereum | 43.8% |
| Boba Network | 38.2% |
| Scroll | 34.4% |
| Ronin | 34.3% |
Sei Network dominates with 116.6% 30-day movement. Meanwhile, StarkNet’s 30-day movement is 85.4% and Aptos’s 30-day movement is 60.5%. Hedera Hashgraph, Mantle, Solana, Ethereum, Boba Network, Scroll and Ronin also experience impressive 30-day movement.
2. Blockchain Comparative Analysis: How Top Blockchains Performed This Month
By focusing on four aspects, you can gain insights into the economic strength, development activity, market stability, and adoption potential of each blockchain.
2.1. Blockchain Analysis: Total Value Locked and Economic Activity
Let’s assess the economic activity within each blockchain’s ecosystem. A higher TVL, transaction volume, and revenue may indicate a more vibrant and utilized blockchain.
| Blockchains | Revenue | Fees | Volume | TVL |
| Ethereum | 10740K USD | 12060k USD | 1772M USD | $48,409,240,331 |
| TRON | 1560K USD | 1560K USD | 53.77M USD | $8,575,920,943 |
| BNB Smart Chain | 51.41K USD | 514.1K USD | 698.55M USD | $4,553,551,332 |
| Arbitrum One | 85.91K USD | 400.26K USD | 413.81M USD | $3,523,328,614 |
| Solana | 1.66K USD | 3.32K USD | 656.14M USD | $2,112,119,544 |
| Polygon POS | 34.29K USD | 79.94K USD | 149.89M USD | $1,027,218,469 |
| Optimism | -12.97K USD | 214.1K USD | 91.5M USD | $944,636,046 |
| Avalanche | 41.68K USD | 41.68K USD | 77.07M USD | $936,810,058 |
| Manta Pacific | $547,258,490 | |||
| Base | 19.08K USD | 179.11K USD | 40.27M USD | $405,441,699 |
The data showcase total value locked in the top ten blockchains. Ethereum dominates with $48.4 billion, followed by TRON and BNB Smart Chain. Solana and Polygon POS also exhibit substantial values. This indicates Ethereum’s entrenched position, while emerging networks like Solana show potential for growth in decentralised finance.
The data illustrates volumes in the top ten blockchains, with Ethereum leading at 1772M USD, followed by BNB Smart Chain and Solana. Ethereum’s high volume indicates its continued dominance in transactions. Solana’s notable volume suggests growing adoption, while BNB Smart Chain’s position underscores Binance’s significant presence in the blockchain space.
The data reveals fees in the top blockchains, with Ethereum leading at 12060k USD, followed by TRON and BNB Smart Chain.
The data depicts revenue in the top ten blockains, with Ethereum leading at 10740K USD, followed by TRON and Arbitrum One. Ethereum’s high revenue indicates its thriving ecosystem. Negative revenue on Optimism suggests early challenges.
Anway, in the blockchain economic analysis, revenue, fees, volume and TVL indices provide vital insights. Revenue showcases the financial health of networks, with Ethereum leading, indicating a thriving ecosystem despite Optimism’s early challenges. Fees reflect transaction costs, where Ethereum dominates, suggesting network congestion. Volume highlights transaction activity, with Etheruem’s dominance and Solana’s growing adoption evident. TVL signifies the value invested in DeFi, showcasing Ethereum’s entrenched position and Solana’s potential.
2.2. Blockchain Analysis: Development and Innovation
Let’s evaluate the development activity and innovation within each blockchain. A blockchain with a strong development community, active core developers, and more commits may suggest ongoing improvement and evolution.
| Blockchains | Commits | Core Developers |
| Ethereum | 9870 | 330 |
| TRON | 26 | 4 |
| BNB Smart Chain | 148 | 20 |
| Arbitrum One | 1760 | 41 |
| Solana | 500 | 28 |
| Polygon POS | 209 | 17 |
| Optimism | 2300 | 46 |
| Avalanche | 1680 | 37 |
| Manta Pacific | ||
| Base | 155 | 15 |
The data presents the number of core developers in the top blockchains, with Ethereum leading at 330, followed by Optimism and Arbitrum One. Ethereum’s large developer base indicates robust ecosystem support and ongoing development efforts. Optimism and Arbitrum One also show significant developer activity, crucial for maintaining and improving blockchain protocols. Networks with fewer developers like TRON may face challenges in keeping up with innovation and security standards.
The data displays commit counts in the top blockchain, with Etheruem leading at 9870, followed by Optimism and Arbitrum One. High commit counts signify active development and maintenance of blockchain protocols. Etheruem’s substantial commits indicate ongoing enhancements and updates, crucial for its robustness. Networks like TRON with fewer commits may encounter difficulties in keeping up with technological advancements and ensuring security.
Notably, core developers and commit indices are crucial for assessing development and innovation. Core developers represent the talent pool driving blockchain advancements, with Ethereum leading at 330, indicating strong ecosystem support. High commit counts, led by Ethereum at 9870, signify active protocol development and maintenance. Networks like Optimism and Arbitrum One show significant developer activity, vital for protocol improvement. However, networks with fewer developers like TRON may lag in innovation and security, emphasising the importance of developer support for sustainable blockchain evolution.
2.3. Blockchain Analysis: Market Performance and Stability
Let’s analyse the market performance and stability of each blockchain’s native cryptocurrency. The prevalence and usage of stablecoins within the ecosystem can measure stability and potential as a medium of exchange.
| Blockchains | Stablecoins Market Cap | Price |
| Ethereum | 71.288B USD | 2.98K USD |
| TRON | 51.506B USD | 0.1 USD |
| BNB Smart Chain | 4.732B USD | 351.8 USD |
| Arbitrum One | 2.226B USD | 2 USD |
| Solana | 2.206B USD | 108.6 USD |
| Polygon POS | 1.451B USD | 1 USD |
| Optimism | O.632B USD | 3.8 USD |
| Avalanche | 1.206B USD | 37.7 USD |
| Manta Pacific | ||
| Base | 0.3B USD | Nil |
As per the above data, Ethereum leads with a substantial market cap of 71.288B USD, indicating its dominant position. TRON follows closely, reflecting its strong market presence. BNB Smart Chain also shows significant market cap, underscoring Binance’s influence. Stablecoin market caps are indicators of investor confidence and network stability, with higher values suggesting greater adoption and resilience. However, lower market caps like Base’s 0.3B USD may imply lower stability or adoption rates, emphasising the need for sustained growth and market confidence.
2.4. Blockchain Analysis: Adoption and User Interest
Let’s examine the level of adoption and user interest by looking at inflows, coin price and market capitalisation. A blockchain with increasing user interest and growing market capitalisation may indicate a higher level of adoption.
| Blockchains | Token Market Cap | Net Inflows | Token Price |
| Ethereum | 358.397B USD | 29.78M USD | 2.98K USD |
| TRON | 12.263B USD | Nil | 0.1 USD |
| BNB Smart Chain | Nil | Nil | 351.8 USD |
| Arbitrum One | 2.564B USD | -110M USD | 2 USD |
| Solana | 47.893B USD | -0.7M USD | 108.6 USD |
| Polygon POS | 8.831B USD | -0.61M USD | 1 USD |
| Optimism | 3.618B USD | -5.25M USD | 3.8 USD |
| Avalanche | 13.865B USD | 0.978M USD | 37.7 USD |
| Manta Pacific | |||
| Base | nil | 3.3M USD | Nil |
The data depicts net inflow in the top blockchains. Ethereum leads with a positive inflow of 29.78M USD, indicating investor interest. Base and Avalanche also show positive inflows, albeit smaller. However, Arbiturm One exhibits a substantial negative inflow of -110M USD, suggesting significant funds moving out. Optimism, Solana, and Polygon POS show moderate negative inflows.
The date presents token market caps. Ethereum dominates with a market cap of 358.397B USD, reflecting its established position. Solana follows with 47.893B USD, showcasing its growing popularity. Avalanche, TRON, and Polygon POS also exhibit significant market caps. Meanwhile, Optimism and Arbitrum One show comparatively smaller market caps.
Let’s explore the adoption and user interest factor of the top blockchains using the above indices.
Token market cap and net inflow data are crucial for analysing blockchain adoption and user interest. Market cap reflects overall investor sentiment and network value, while net inflow indicates recent capital movements, highlighting investor activity and sentiment shifts.
Ethereum’s high market cap and positive net inflow suggest strong adoption and sustained user interest. Solana’s growing market cap supports its increasing popularity. However, substantial negative inflows in Arbitrum One and moderate negative inflows in Optimism, Solana and Polygon POS may signal investor caution or shifting preferences, impacting adoption rates.
The report covers all the vital developments the blockchain sector has witnessed in this month. The report is the product of the fine blend of professional analysis and quality data.
In This News
Coins

$ 1.80K
-0.14%
$ 0.330
0%
$ 572.11
-0.66%
$ 0.00...361

$ 0.000365


Predictions Markets
See what traders are focused on
Share:
In This News
Coins
$ 1.80K
-0.14%$ 0.330
0%$ 572.11
-0.66%$ 0.00...361
$ 0.000365
Predictions Markets
See what traders are focused on
Share:
Read More

Insider-Linked Wallet Moves Another $9.15M in LAB Tokens to Aster, Raising Market Concerns